Juliette Cubanski Follow @jcubanski on
Twitter and Tricia Neuman Follow @tricia_neuman on
Twitter Published: Oct 18, 2019
Some recent proposals to lower prescription
drug costs would require drug manufacturers to pay a rebate to the federal
government if their prices for drugs covered under Medicare Part B and Part D
increase by more than the rate of inflation. This proposal is included in
recent legislation passed by the Senate Finance Committee (S. 2543, Prescription Drug
Pricing Reduction Act of 2019) and introduced by Speaker Pelosi in
the House of Representatives (H.R. 3, Lower Drug Costs Now
Act of 2019). The Administration’s FY2020 budget includes
a related proposal that applies only to drugs covered under Part B. (See Table
1 for a comparison of these proposals.) The Medicaid program currently has a
similar policy in place.
This data note analyzes changes in list prices
for drugs covered by Medicare Part D in recent years compared to changes in the
rate of inflation. The analysis is based on data from the CMS’s most
recent Medicare Part D drug spending
dashboard. Changes in list prices for Part D drugs are measured by
one-year (2016-2017) and three-year (2014-2017) changes in average spending per
dosage unit amounts reported in the dashboard. We compare these changes to the
rate of increase in the Consumer Price Index for all urban consumers (CPI-U)
over the same time periods. We analyze price changes for all drugs reported in
the dashboard in 2017, along with the top 10 drugs by total Medicare Part D
spending and the top 10 most commonly-used drugs in Part D in 2017 that had
price increases between 2016 and 2017 above the rate of inflation. (See Methods
for additional details.)
This analysis provides context for understanding
the basic approach of an inflation rebate policy. It is not an analysis of any
specific provision in either the House or Senate bills nor is it similar to a
CBO cost estimate. Our analysis is based on unit prices that do not reflect
manufacturer rebates and discounts to plans, which are considered proprietary
and therefore not publicly available; the Senate Finance Committee inflation
rebate proposal is also based on list prices (Wholesale Acquisition Cost),
while the House proposal is based on Average Manufacturer Price, which may
include some discounts to wholesalers but not rebates paid to plans and PBMs.
Key Findings
·
For many drugs covered
by Medicare Part D in 2017, list prices increased faster than inflation by
several percentage points. Of the 2,879 drugs reported in 2017 in the Part D
dashboard, including both brand-name and generic drugs, 60% (1,733 drugs) had
list price increases that exceeded the inflation rate between July 2016 and
July 2017, which was 1.7%.
·
Among the top 25 drugs
by total Medicare Part D spending in 2017, all of which were brand-name drugs,
20 had list price increases between 2016 and 2017 that exceeded the inflation
rate, in some cases by several percentage points; for example, 15.7% for
Lyrica, a pain medication, 15.3% for Revlimid, a cancer medication, and 13.2%
for Humira Pen, for rheumatoid arthritis. For these 20 drugs, price increases
ranged from 3 times to more than 9 times the rate of inflation.
·
Among the 96 drugs
used by more than 1 million Part D enrollees in 2017, roughly one-fifth of
these drugs (22 drugs) had list price increases between 2016 and 2017 above the
rate of inflation. Of the 22 most-commonly used drugs with price increases
above inflation, 17 were generics (77%); half of the products (11) had list
price increases below 5%, while price increases for the remaining half of
products ranged from 6% to 32%–or 3 to 18 times the rate of inflation.
Findings
PRICE
CHANGES AMONG ALL DRUGS COVERED BY PART D
Of the 2,879 drugs reported in 2017 in the
Part D dashboard, including both brand-name and generic drugs, 60% (1,733
drugs) had list price increases that exceeded the inflation rate between July
2016 and July 2017, which was 1.7% (Figure 1). One-fourth of all Part D drugs
had price increases of at least 10% between 2016 and 2017, and more than
one-third (35%) had price increases above the rate of inflation but below 10%.
Another 284 drugs (10%) had price increases below inflation, while for the
remainder (859 drugs, or 30%), list prices decreased between 2016 and 2017.
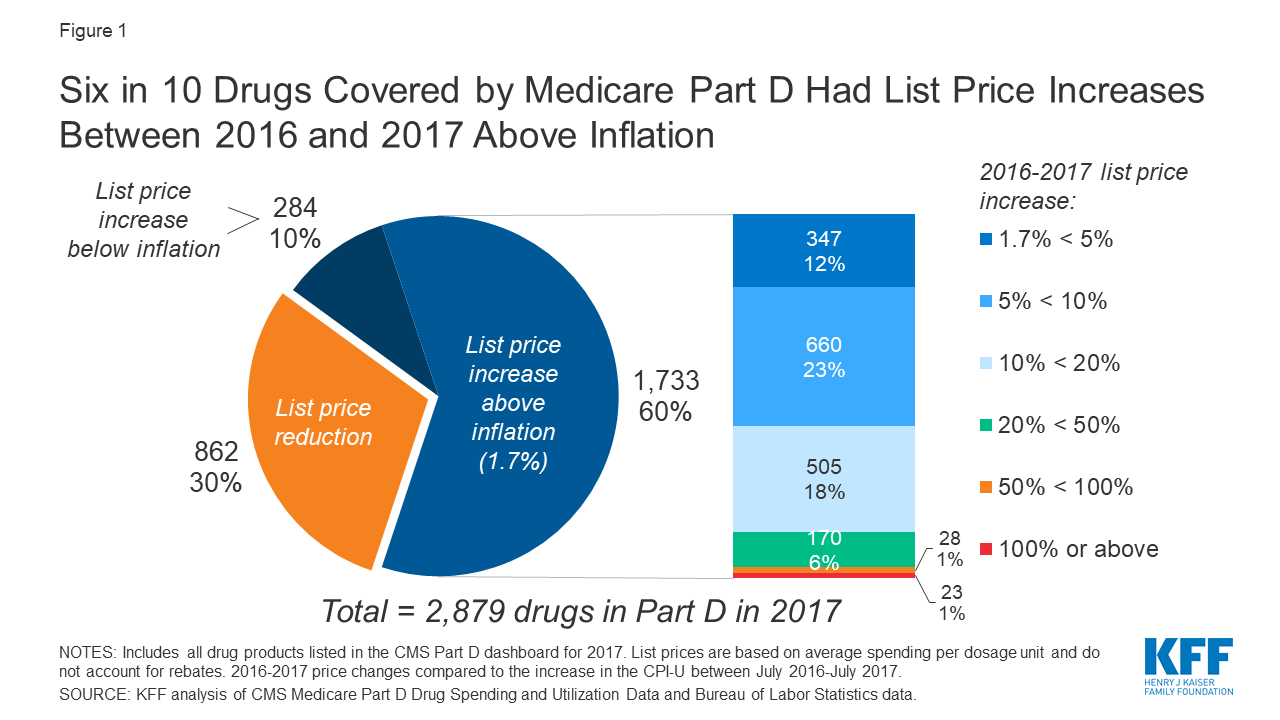
Figure 1: Six in 10
Drugs Covered by Medicare Part D Had List Price Increases Between 2016 and 2017
Above Inflation
PRICE
INCREASES AMONG TOP DRUGS BY TOTAL PART D SPENDING
Focusing on the top 25 drugs by total Medicare
Part D spending in 2017, all of which were brand-name drugs, 20 had list price
increases between 2016 and 2017 above the inflation rate (Table 2). For these
20 drugs, price increases ranged from 3 times to more than 9 times the rate of
inflation.
Among the top 10 of this subset of drugs, list
price increases exceeded the inflation rate by several percentage points,
including four drugs with double-digit increases: 15.7% for Lyrica, a pain
medication used by 0.9 million Part D enrollees in 2017; 15.3% for Revlimid, a
cancer medication used by 37,000 enrollees; 13.2% for Humira Pen, for
rheumatoid arthritis, taken by 52,000 enrollees; and 11.0% for Novolog Flexpen,
an insulin therapy used by nearly 550,000 enrollees (Figure 2). Four of these
10 drugs are taken by roughly one million or more Part D enrollees (Eliquis,
Xarelto, Advair Diskus, and Symbicort).
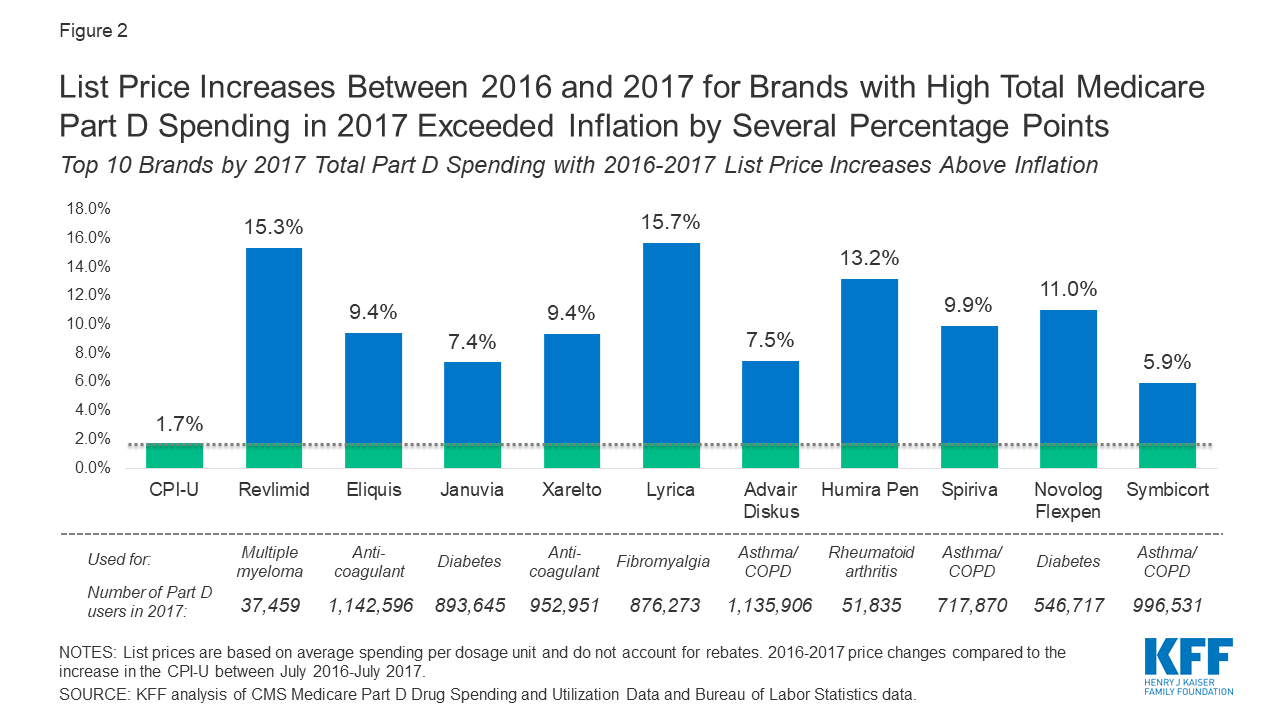
Figure 2: List Price
Increases Between 2016 and 2017 for Brands with High Total Medicare Part D
Spending in 2017 Exceeded Inflation by Several Percentage Points
A similar pictures
emerges for list price increases over a three-year period (from 2014 to 2017),
when the average annual rate of inflation was 0.9%. Over this longer time
frame, six of the top 10 brands by total spending with list prices that
exceeded inflation had list price increases in the double digits, including
Humira Pen (18.8%), Lyrica (15.9%), Novolog Flexpen (14.8%), Revlimid (11.6%),
Xarelto, a blood thinner (10.2%), and Januvia, a diabetes treatment (10.0%)
(Figure 3).
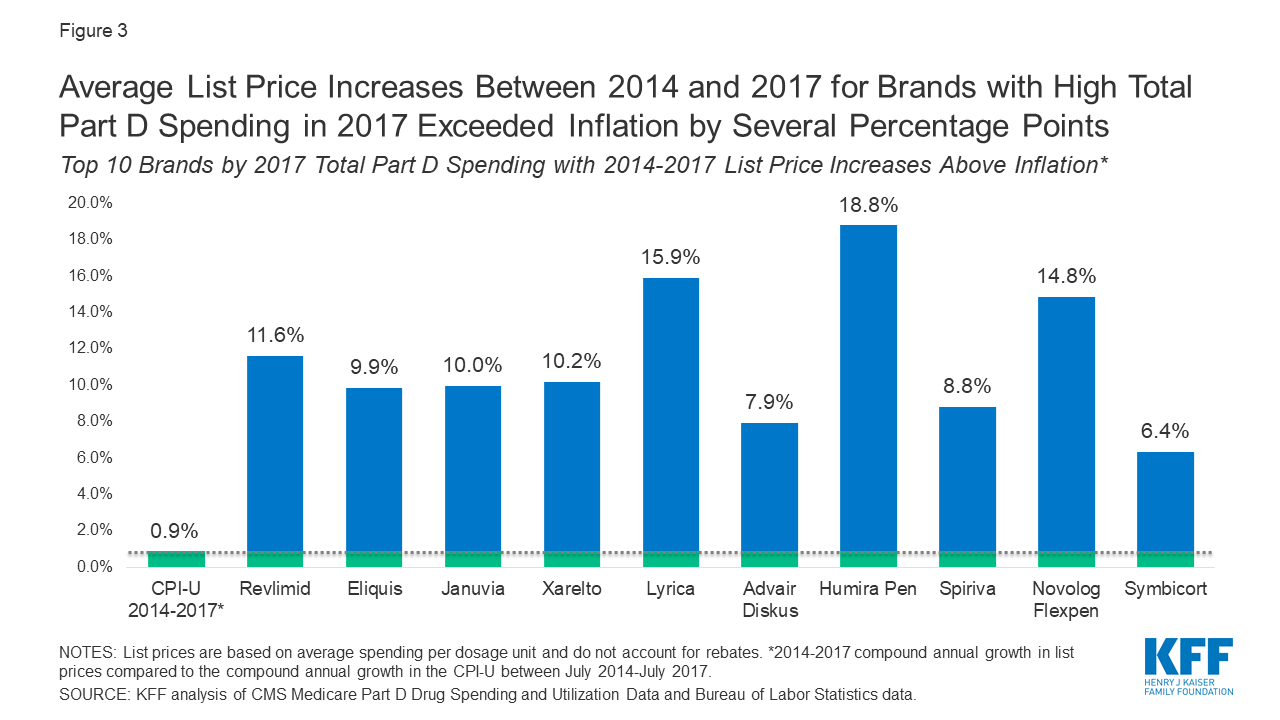
Figure 3: Average List
Price Increases Between 2014 and 2017 for Brands with High Total Part D
Spending in 2017 Exceeded Inflation by Several Percentage Points
PRICE
INCREASES AMONG MOST-COMMONLY USED MEDICARE PART D DRUGS
There were 96 drugs used by more than 1
million Part D enrollees in 2017, and 22 of these drugs had list price
increases between 2016 and 2017 above the rate of inflation (Table 3). Among
these 22 most commonly-used products in Part D, 17 were generics (77%); half of
the products (11) had list price increases below 5%, while price increases for
the remaining half of products ranged from 6% to 32%—or 3 to 18 times the rate
of inflation.
Focusing in on the top 10 of this subset of
most commonly-used drugs in Part D with price increases above inflation, the
list includes eight generic drugs and two brands (the asthma treatments Proair
and Ventolin). Price increases among these top 10 most commonly-used drugs with
price increases between 2016 and 2017 above inflation were all below 10%; five
of the 10 were less than 5% (Figure 4).
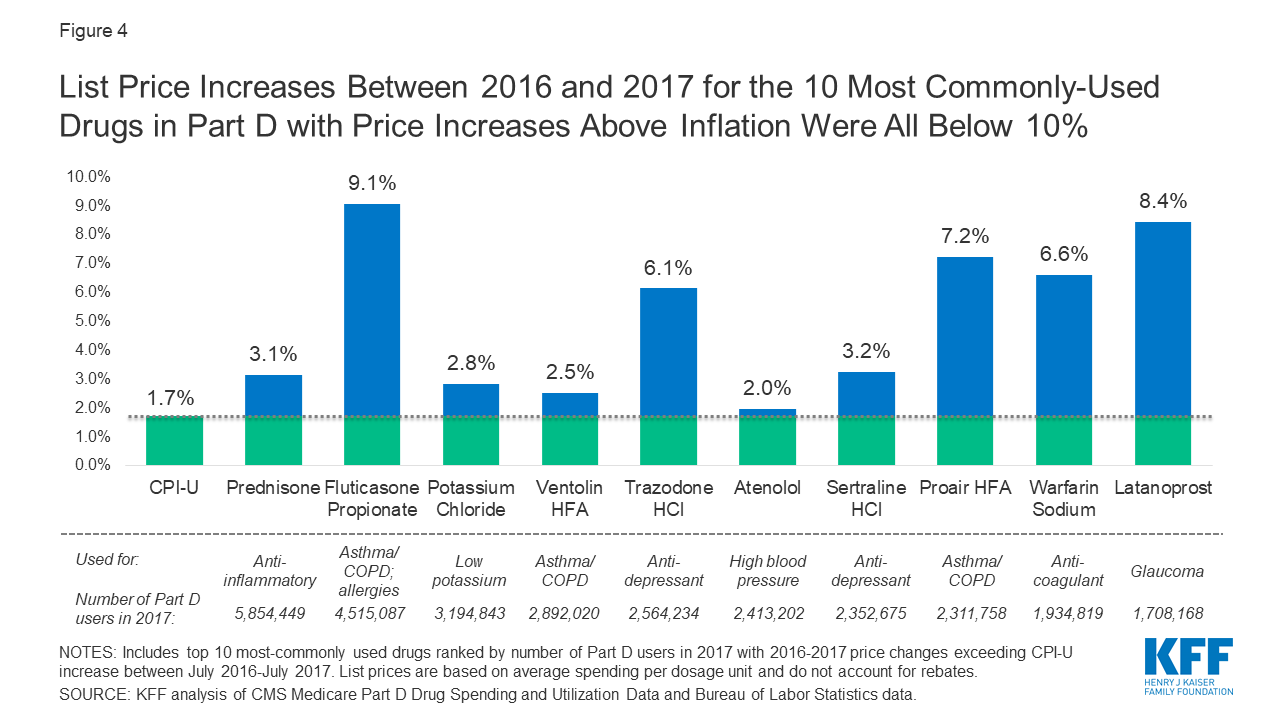
Figure 4: List Price
Increases Between 2016 and 2017 for the 10 Most Commonly-Used Drugs in Part D
with Price Increases Above Inflation Were All Below 10%
Conclusion
This analysis documents that list price
increases for many Part D drugs exceeded inflation in previous years, in some
cases by a substantial margin. While some data suggests that
overall drug price increases may have moderated in more recent years, there is
also evidence that
prices for specific drugs continue to rise at rates above inflation.
Our analysis suggests the potential for
savings if drug manufactures limited price increases to the rate of inflation
or paid a rebate to the federal government, as has been proposed in recent
legislation. The magnitude of actual changes in spending would depend on
numerous details specified in legislation, including the drugs to which the
policy applies, the price measure used to compare against inflation, and the
base year used for calculating rebates, as well as how drug companies respond
(e.g., increasing launch prices for new drugs or decreasing existing rebates).
In a preliminary estimate of
the Senate Finance Committee legislation, the Congressional Budget Office (CBO)
estimated a $57.5 billion reduction in Medicare spending between 2020-2029 due
to the Part D inflation rebate proposal, and a $10.7 billion reduction due to
the Part B inflation rebate proposal. CBO has not yet estimated the effects of
the inflation rebate proposals in H.R. 3.
Medicare beneficiaries could also benefit from
a policy that constrained the growth in list prices. This is because cost
sharing under Part D often comes in the form of coinsurance, which is
calculated as a percentage of the list price. To the extent that an inflation
rebate policy also resulted in slower growth in overall Part D program costs,
beneficiaries could also see lower Part D plan premiums. CBO estimated $10
billion in savings on cost sharing and premiums for Part D enrollees under the
Senate Finance Committee’s Part D inflation rebate proposal. However, if drug
manufacturers respond to the policy change by increasing launch prices for new
drugs, some Medicare beneficiaries could face higher out-of-pocket costs for
new drugs that come to market, with potential spillover effects on costs
incurred by other payers as well.
Supported in part by Arnold Ventures.
KFF retains complete control over all of its policy analysis content.
KFF retains complete control over all of its policy analysis content.
|
Methods
|
|
This analysis is
based on data from the most recent release of the Centers for Medicare &
Medicaid Services (CMS) Medicare Drug Spending
Dashboard, which includes data for 2013-2017. Drugs were excluded
from the analysis if they were not in the dashboard data in 2014 (for
analysis of price increases between 2014-2017) or 2016 (for analysis of price
increases between 2016-2017). In this analysis, we use weighted average
spending per dosage unit as the measure of list price, which is reported by
CMS for each drug in the dashboard per year.
Changes in list
prices for Part D drugs are measured by one-year (2016-2017) and three-year
(2014-2017) changes in average spending per dosage unit amounts reported in
the dashboard. We compare these changes to the rate of increase in the
Consumer Price Index for all urban consumers (CPI-U) between July-July over
the same time periods. We report the compound annual growth rate for
three-year changes in list prices and inflation.
We analyzed price
changes for all drug products reported in the dashboard for 2017. In
addition, we sorted all drugs in the dashboard by the calendar 2017 total
spending amount reported in the dashboard and by number of beneficiaries
using each drug in 2017, and report data for the top 10 drugs for each subset
with price increases (i.e., weighted average spending per dosage unit)
greater than inflation.
|
|
Table 1: Comparison of Proposals
Related to Drug Price Increases Above the Rate of Inflation
|
|||
|
Features
|
H.R. 3: Lower Drug Costs Now
Act of 2019
|
S. 2543: Prescription Drug
Pricing Reduction Act of 2019
|
Trump Administration FY2020
Budget
|
|
Applies to Part
B/Part D
|
Part B and Part D
|
Part B and Part D
|
Part B
|
|
Applies to
brands/generics
|
Part B: brands, biologics, and
biosimilars
Part D: All drugs |
Brands and biologics only
|
Not specified
|
|
Base year
|
2016
|
2019
|
2018
|
|
Implementation
year
|
2022
|
Part B: 2021; Part D: 2022
|
2020
|
|
Base price for
determining inflation-adjusted price
|
Part B: ASP
Part D: AMP
|
Part B: ASP
Part D: WAC
|
Part B: ASP
|
|
Rebate required
for increasing drug price faster than rate of inflation
|
√
|
√
|
Not applicable*
|
|
Civil monetary
penalty for not paying rebate within 30 days
|
125% of rebate amount
|
125% of rebate amount
|
Not applicable*
|
|
NOTES: ASP is
average sales price. AMP is average manufacturer price. WAC is wholesale
acquisition cost. *Under FY2020 budget proposal, CMS wouldn’t pay more for a
Part B drug than the inflation-adjusted price, so a rebate would not be
needed.
SOURCE:
KFF analysis of provisions of H.R. 3, S. 2543, and Administration’s FY2020
budget.
|
|||
|
Table 2: List Price Changes Between
2016-2017 for Top 25 Drugs by Total Medicare Part D Spending in 2017
|
|||
|
Drug name
|
Total Part D spending, 2017
|
Number of users, 2017
|
2016-2017 list price growth
|
|
Revlimid
|
$3,312,773,264
|
37,459
|
15.3%
|
|
Eliquis
|
$3,076,266,439
|
1,142,596
|
9.4%
|
|
Januvia
|
$2,786,062,255
|
893,645
|
7.4%
|
|
Lantus Solostar
|
$2,631,724,728
|
1,112,315
|
0.9%*
|
|
Xarelto
|
$2,611,721,793
|
952,951
|
9.4%
|
|
Harvoni
|
$2,555,839,934
|
32,397
|
0.1%*
|
|
Lyrica
|
$2,517,073,735
|
876,273
|
15.7%
|
|
Advair Diskus
|
$2,374,829,262
|
1,135,906
|
7.5%
|
|
Humira Pen
|
$2,015,734,946
|
51,835
|
13.2%
|
|
Spiriva
|
$1,662,019,570
|
717,870
|
9.9%
|
|
Lantus
|
$1,553,906,987
|
614,743
|
0.3%*
|
|
Novolog Flexpen
|
$1,533,124,007
|
546,717
|
11.0%
|
|
Symbicort
|
$1,510,965,216
|
996,351
|
5.9%
|
|
Copaxone
|
$1,499,493,336
|
26,171
|
11.6%
|
|
Sensipar
|
$1,436,678,980
|
154,448
|
14.3%
|
|
Levemir Flextouch
|
$1,404,127,510
|
509,282
|
0.2%*
|
|
Ibrance
|
$1,399,517,851
|
20,441
|
8.1%
|
|
Imbruvica
|
$1,368,727,295
|
18,744
|
10.9%
|
|
Renvela
|
$1,316,266,396
|
183,928
|
1.5%*
|
|
Enbrel Sureclick
|
$1,157,839,006
|
32,005
|
14.5%
|
|
Humalog Kwikpen
U-100
|
$1,090,043,555
|
414,797
|
9.0%
|
|
Restasis
|
$1,049,441,691
|
565,560
|
9.2%
|
|
Victoza 3-Pak
|
$1,031,526,061
|
214,934
|
9.9%
|
|
Tecfidera
|
$1,024,106,779
|
17,055
|
12.0%
|
|
Latuda
|
$991,725,695
|
111,857
|
16.8%
|
|
NOTES: List
prices are based on average spending per dosage unit and do not account for
rebates. * indicates list price increase below the increase in the CPI-U
between July 2016-July 2017 (1.7%).
SOURCE:
KFF analysis of CMS Medicare Part D Drug Spending and Utilization Data,
2016-2017.
|
|||
|
Table 3: List Price Changes Between
2016-2017 for Most Commonly Used Part D Drugs in 2017 with List Price
Increases Above Inflation
|
||
|
Drug name
|
Number of users, 2017
|
2016-2017 list price growth
|
|
Prednisone
|
5,854,449
|
3.14%
|
|
Fluticasone
Propionate*
|
4,515,087
|
9.06%
|
|
Potassium
Chloride*
|
3,194,843
|
2.84%
|
|
Ventolin HFA
|
2,892,020
|
2.52%
|
|
Trazodone HCl
|
2,564,234
|
6.14%
|
|
Atenolol
|
2,413,202
|
1.96%
|
|
Sertraline HCl
|
2,352,675
|
3.24%
|
|
Proair HFA
|
2,311,758
|
7.24%
|
|
Warfarin Sodium
|
1,934,819
|
6.61%
|
|
Latanoprost
|
1,708,168
|
8.44%
|
|
Mupirocin
|
1,639,334
|
1.92%
|
|
Cyclobenzaprine
HCl
|
1,624,555
|
31.00%
|
|
Naproxen
|
1,587,484
|
3.36%
|
|
Glimepiride
|
1,326,711
|
6.24%
|
|
Polyethylene
Glycol 3350
|
1,322,866
|
32.21%
|
|
Fluoxetine HCl
|
1,266,054
|
4.49%
|
|
Mirtazapine
|
1,212,203
|
3.17%
|
|
Eliquis
|
1,142,596
|
9.40%
|
|
Advair Diskus
|
1,135,906
|
7.48%
|
|
Isosorbide
Mononitrate ER
|
1,127,360
|
6.18%
|
|
Ketoconazole*
|
1,119,831
|
2.16%
|
|
Synthroid
|
1,045,781
|
3.40%
|
|
NOTES: List
prices are based on average spending per dosage unit and do not account for
rebates. Excludes 74 drugs with more than 1 million users in 2017 with price
changes below inflation or price reductions.
SOURCE:
KFF analysis of CMS Medicare Part D Drug Spending and Utilization Data,
2016-2017.
|
||
This comment has been removed by a blog administrator.
ReplyDelete