Gretchen Jacobson Follow @GretchJacob on
Twitter, Meredith Freed, Anthony Damico,
and Tricia Neuman Follow @tricia_neuman on Twitter Published: Jun 06, 2019
Medicare Advantage enrollment has grown
rapidly over the past decade, and Medicare Advantage plans have taken on a larger role in the Medicare
program. This data collection provides current information and trends about Medicare Advantage enrollment, premiums, and
out-of-pocket limits. It also includes analyses of Medicare Advantage plans’
extra benefits and prior authorization requirements.
1. Enrollment in
Medicare Advantage has nearly doubled over the past decade
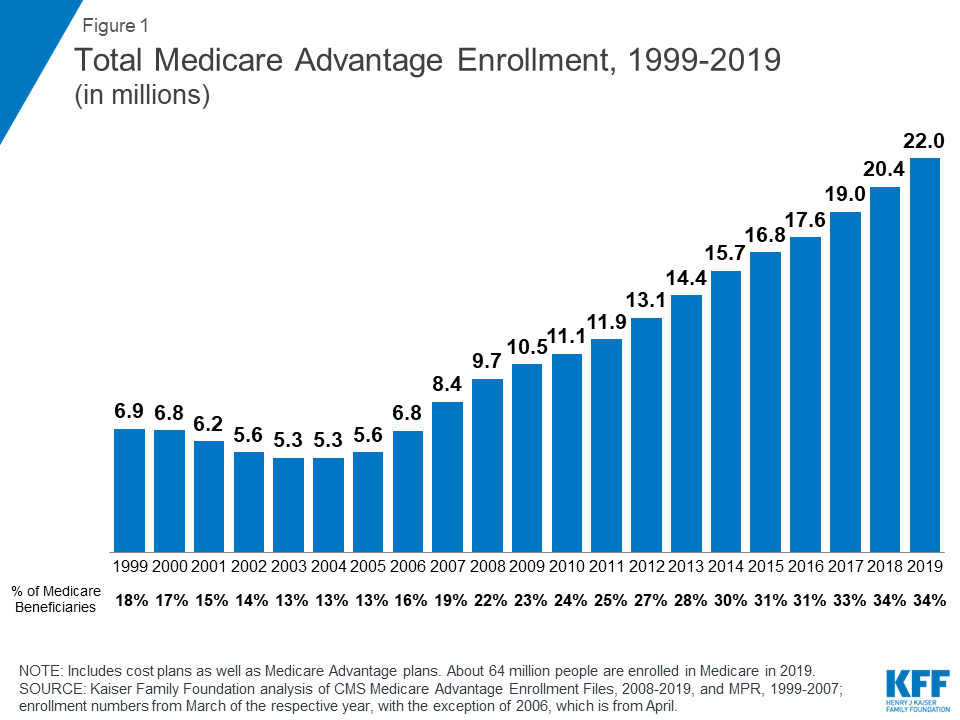
Figure 1: Total
Medicare Advantage Enrollment, 1999-2019 (in millions)
In 2019, one-third (34%) of all Medicare
beneficiaries – 22 million people – are enrolled in Medicare Advantage plans,
similar to the rate in 2017 and 2018. Between 2018 and 2019, total Medicare
Advantage enrollment grew by about 1.6 million beneficiaries, or 8 percent –
nearly the same growth rate as the prior year. The Congressional Budget Office
(CBO) projects that the share of beneficiaries enrolled in Medicare Advantage
plans will rise to about 47 percent by 2029.
2. The share of
Medicare beneficiaries in Medicare Advantage plans across the United States
ranges from 1% to over 40%
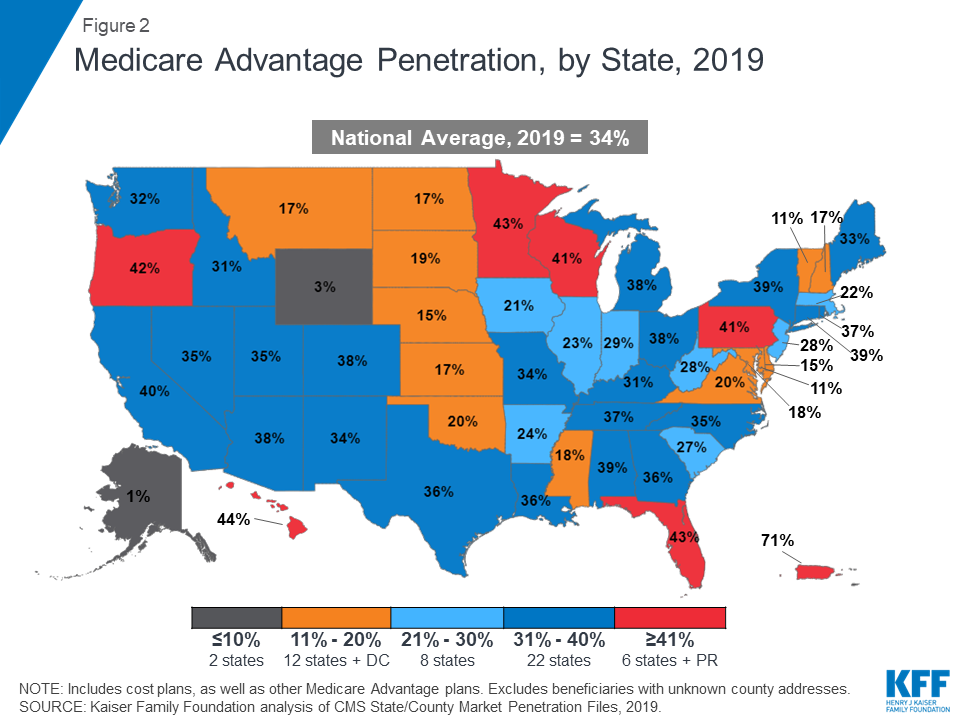
Figure 2: Medicare
Advantage Penetration, by State, 2019
The share of Medicare beneficiaries in
Medicare Advantage plans (including Medicare cost plans), varies across the
country. In 28 states and Puerto Rico, at least 31 percent of Medicare
beneficiaries are enrolled in Medicare Advantage plans, with more than 40
percent of enrollees in six states (HI, FL, MN, OR, WI, PA) and Puerto Rico.
The majority of the Medicare private health plan enrollment in Minnesota has
historically been in cost plans, rather than Medicare Advantage plans, but as
of 2019, most cost plans in Minnesota are no longer offered and have been
replaced with risk-based HMOs and PPOs. Medicare Advantage enrollment is
relatively low (20 percent or lower) in 14 states and the District of Columbia,
including two mostly rural states where it is virtually non-existent (AK and
WY).
3. The share of
Medicare beneficiaries in Medicare Advantage plans varies across counties from
less than 1% to more than 60%
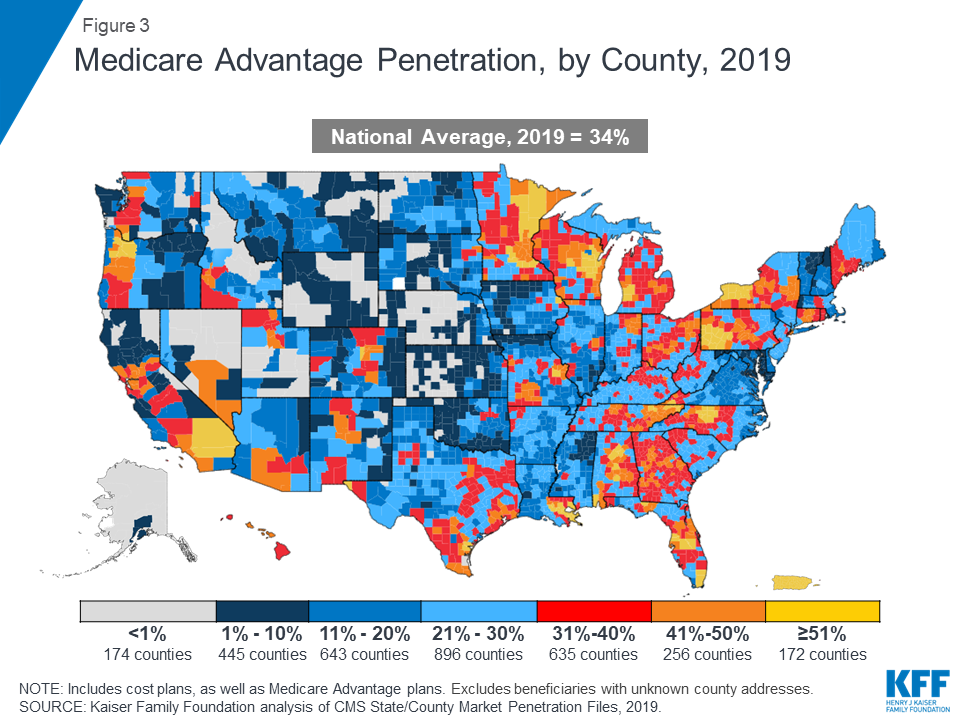
Figure 3: Medicare
Advantage Penetration, by County, 2019
Within states, Medicare Advantage penetration
varies widely across counties. For example, in Florida, 66 percent of all
beneficiaries living in Miami-Dade County are enrolled in Medicare Advantage
plans whereas only 10 percent of beneficiaries living in Monroe County (Key
West) do so. In 172 counties, accounting for 10 percent of the population, more
than half of all Medicare beneficiaries are enrolled in Medicare Advantage
plans or cost plans. Many of these counties are centered around large, urban
areas, such as Monroe County, NY (66%), which includes Rochester, and Allegheny
County, PA (61%), which includes Pittsburgh. In contrast, in 619 counties,
accounting for 4 percent of Medicare beneficiaries, no more than 10 percent of
beneficiaries are enrolled in Medicare private plans; many of these low
penetration counties are in rural parts of the country but some urban areas,
such as Baltimore City (17%), also have relatively low Medicare Advantage
enrollment.
4. Most Medicare
Advantage enrollees are in plans operated by UnitedHealthcare, Humana, or
BlueCross BlueShield (BCBS) affiliates in 2019
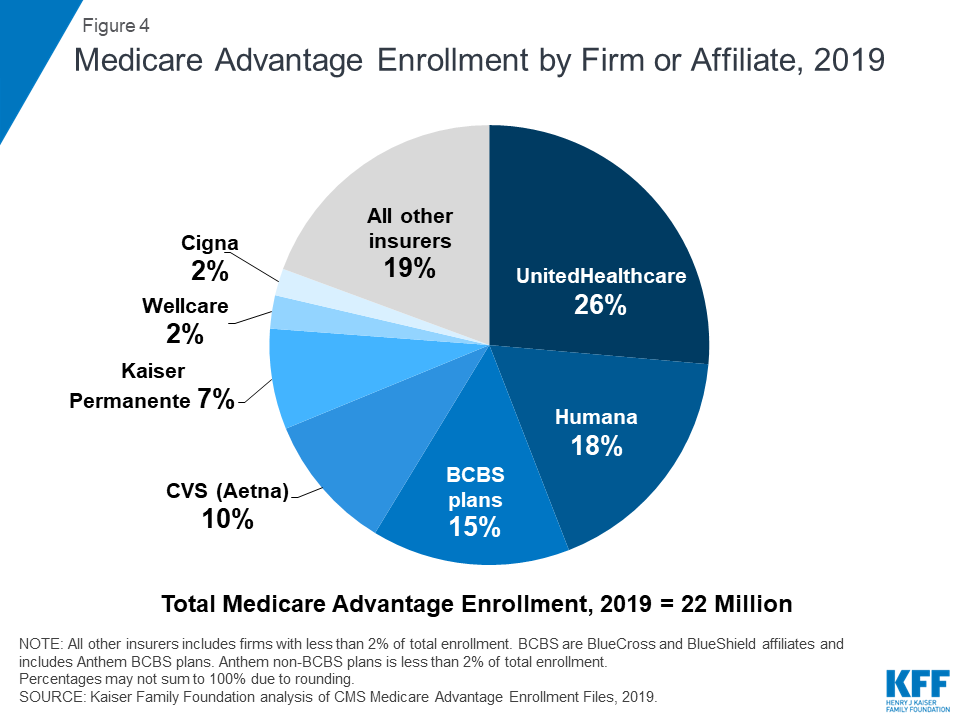
Figure 4: Medicare
Advantage Enrollment by Firm or Affiliate, 2019
Medicare Advantage enrollment is highly
concentrated among a small number of firms. UnitedHealthcare and Humana
together account for 44 percent of all Medicare Advantage enrollees nationwide,
and the BCBS affiliates (including Anthem BCBS plans) account for another 15
percent of enrollment in 2019. Another four firms (CVS/Aetna, Kaiser
Permanente, Wellcare, and Cigna) account for another 22 percent of enrollment
in 2019. For the third year in a row, enrollment in UnitedHealthcare’s plans
grew more than any other firm, increasing by about 520,000 beneficiaries
between March 2018 and March 2019. CVS purchased Aetna in 2018 and the combined
company had the second largest growth in Medicare Advantage enrollment in 2019,
increasing by also about 520,000 beneficiaries between March 2018 and March
2019.
5. Half of Medicare
Advantage enrollees pay no premium (other than the Part B premium) in 2019
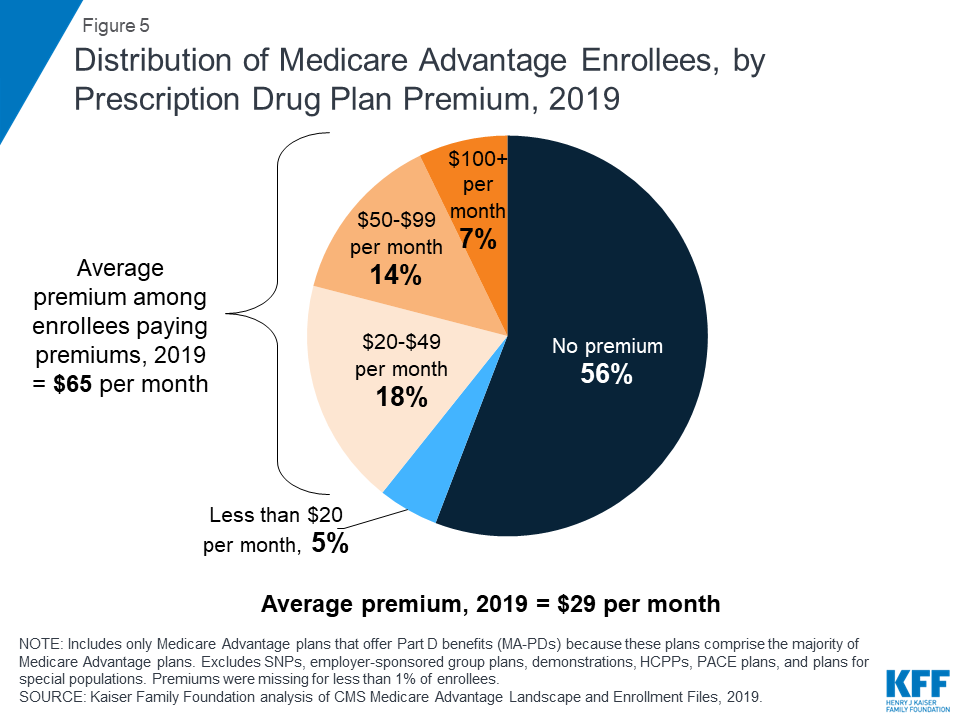
Figure 5: Distribution
of Medicare Advantage Enrollees, by Prescription Drug Plan Premium, 2019
In 2019, 90% of Medicare Advantage plans offer
prescription drug coverage (MA-PDs), and most Medicare Advantage
enrollees (88%) are in plans that include this prescription drug coverage. More
than half of these beneficiaries (56%) pay no premium for their plan, other
than the Medicare Part B premium. However, 21 percent of beneficiaries in
MA-PDs (3.0 million enrollees) pay at least $50 per month, including 7 percent
who pay $100 or more per month, in addition to the monthly Part B premium
($135.50 in 2019). Among MA-PD enrollees who pay a premium for their plan, the
average premium is $65 per month. All together, including those who do not pay
a premium, the average MA-PD enrollee pays $29 per month in 2019.
6. Premiums paid by Medicare
Advantage enrollees have slowly declined since 2015
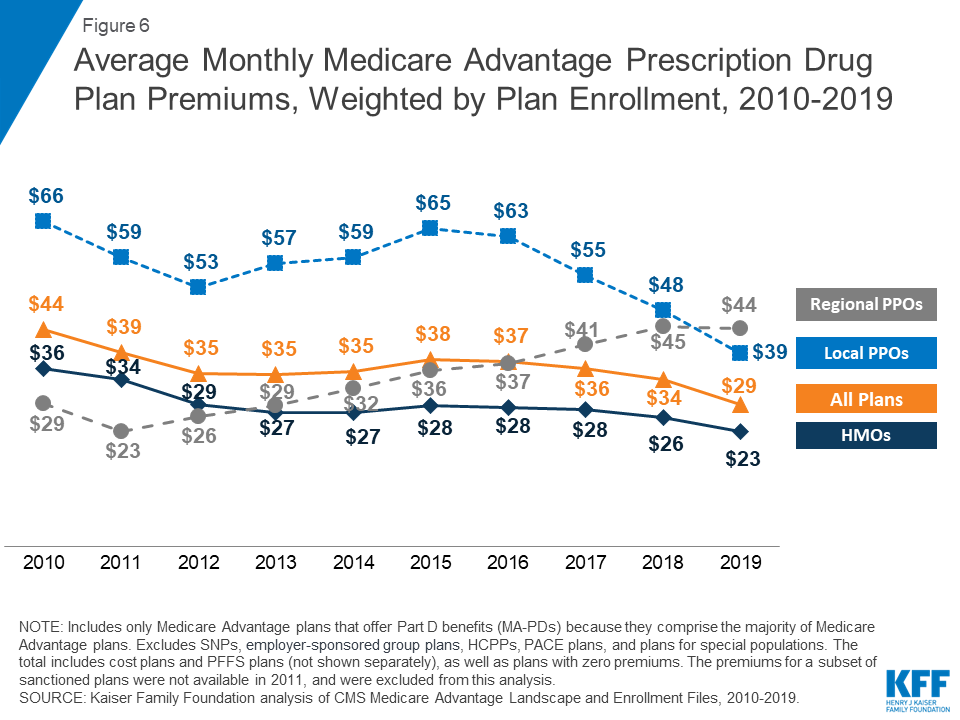
Figure 6: Average
Monthly Medicare Advantage Prescription Drug Plan Premiums, Weighted by Plan
Enrollment, 2010-2019
Nationwide, average Medicare Advantage
Prescription Drug (MA-PD) premiums declined by $5 per month between 2018 and
2019, much of which was due to the relatively sharp decline in premiums for
local PPOs this past year, and since 2015. Average premiums for HMOs also
declined $3 per month, while premiums for regional PPOs were relatively similar
between 2018 and 2019. Average MA-PD premiums vary by plan type, ranging from
$23 per month for HMO enrollees to $39 per month for local PPO enrollees and
$44 per month for regional PPO enrollees. Nearly two-thirds (62%) of Medicare
Advantage enrollees are in HMOs, 31% are in local PPOs, and 6% are in regional
PPOs in 2019.
7. For Medicare
Advantage enrollees, the average out-of-pocket limit is $5,059 for in-network
services and $8,649 for both in-network and out-of-network services (PPOs)
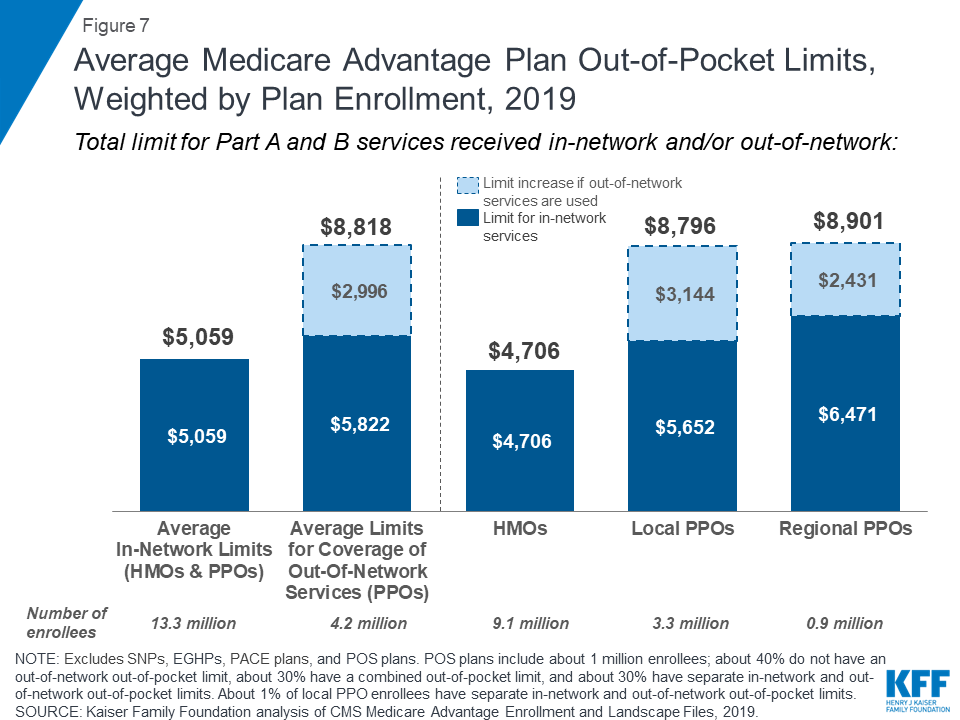
Figure 7: Average
Medicare Advantage Plan Out-of-Pocket Limits, Weighted by Plan Enrollment, 2019
In 2019, Medicare Advantage enrollees’ average
out-of-pocket limit for in-network services is $5,059 (HMOs and PPOs) and
$8,818 for out-of-network services (PPOs). For HMO enrollees, the average
out-of-pocket (in network) limit is $4,706; these plans do not cover services
received from out-of-network providers. For local and regional PPO enrollees,
the average out-of-pocket limit for both in-network and out-of-network services
are $8,796, and $8,901, respectively.
Since 2011, the Administration has required
Medicare Advantage plans to provide an out-of-pocket limit for services covered
under Parts A and B not to exceed $6,700 (in-network) or $10,000 (in-network
and out-of-network combined). Limits have been required for regional PPOs since
2006.
HMOs generally only cover the services
provided by in-network providers, whereas PPOs also cover services delivered by
out-of-network providers but charge enrollees higher cost-sharing for this
care. The size of Medicare Advantage provider networks for physicians and hospitals vary
greatly both across counties and across plans in the same county.
8. Most Medicare
Advantage enrollees have access to some benefits not covered by traditional
Medicare in 2019
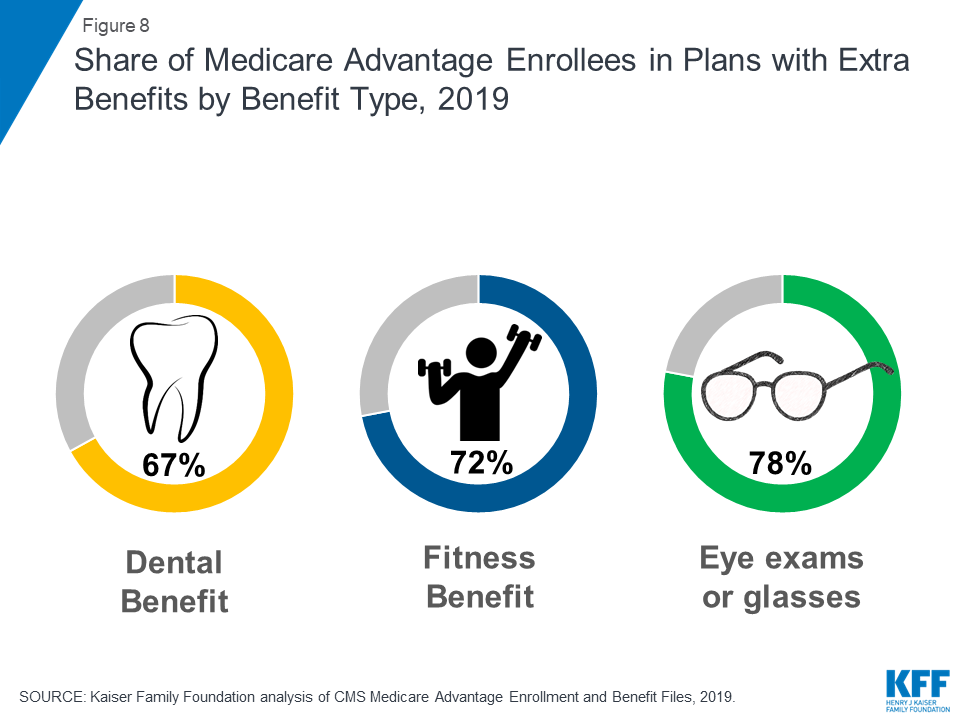
Figure 8: Share of
Medicare Advantage Enrollees in Plans with Extra Benefits by Benefit Type, 2019
Medicare Advantage plans may provide extra
benefits that are not offered in traditional Medicare, and can use rebate
dollars to help cover the cost of extra benefits. Plans can also charge
additional premiums for such benefits. Most enrollees are in plans that provide
access to some dental care (67%), a
fitness benefit (72%), and/or eye exams or glasses (78%). Since 2010, the share
of enrollees in plans that provide some dental care or fitness benefits has
increased (from 48% and 52% of enrollees, respectively) while the share with a
vision benefit has been relatively steady (77% in 2010).
9. Nearly four out of
five Medicare Advantage enrollees are in plans that require prior authorization
for some services
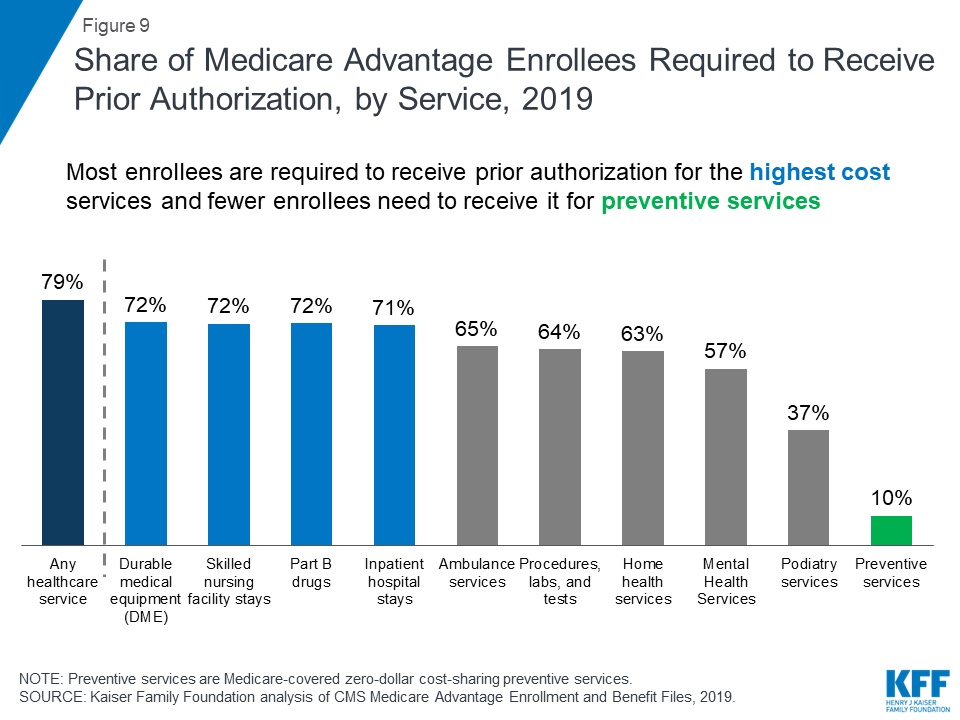
Figure 9: Share of
Medicare Advantage Enrollees Required to Receive Prior Authorization, by
Service, 2019
Medicare Advantage plans can require enrollees
to receive prior authorization before a service will be covered, and nearly
four out of five Medicare Advantage enrollees (79%) are in plans that require
prior authorization for some services in 2019. Prior authorization is most
often required for relatively expensive services, such as inpatient hospital
stays, skilled nursing facility stays, and Part B drugs, but infrequently
required for preventive services. Beginning in 2019, Medicare Advantage plans
can also require enrollees to use “step therapy” for Part B drugs, meaning that
they are required to try some specific drugs (and fail to improve on those
drugs) before they receive approval to try other drugs. In contrast to Medicare
Advantage plans, traditional Medicare does not generally require prior
authorization for services, and does not require step therapy for Part B drugs.
10. The majority (72%)
of Medicare Advantage enrollees are in plans that receive high quality ratings
(4 or more stars) and related bonus payments
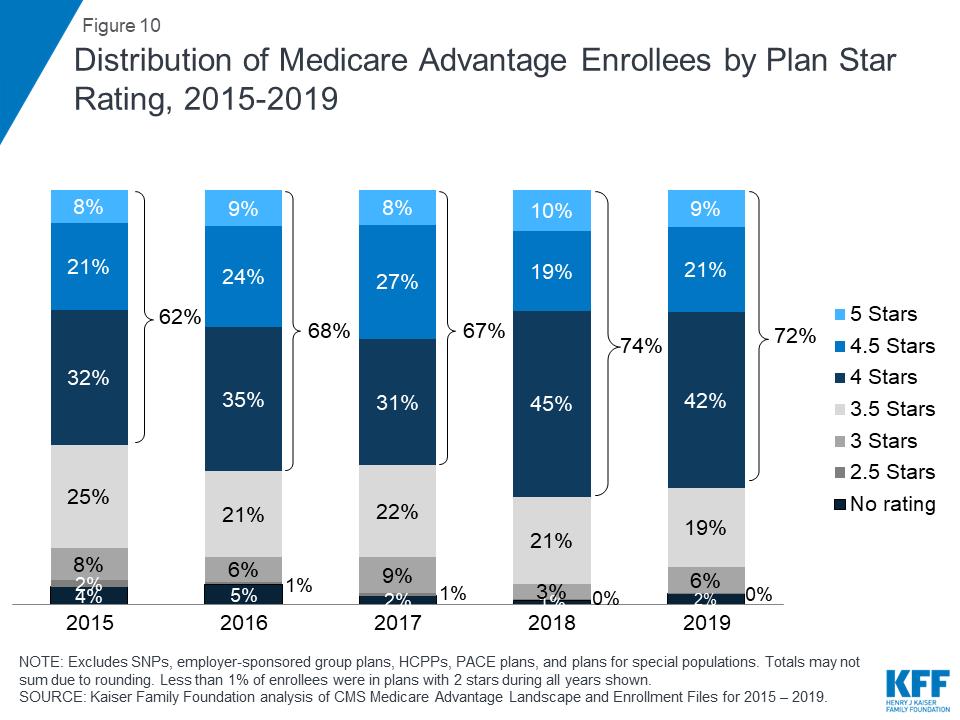
Figure 10:
Distribution of Medicare Advantage Enrollees by Plan Star Rating, 2015-2019
In 2019, more than two-thirds (72%) of
Medicare Advantage enrollees are in plans with quality ratings of 4 or more
stars, a decrease from 74 percent in 2018. An additional 2 percent of enrollees
are in plans that were not rated because they were part of contracts that had
too few enrollees or were too new to receive ratings. Plans with 4 or more stars
and plans without ratings are eligible to receive bonus payments for each
enrollee the following plan year (2020). The share of enrollees in plans with
2.5 stars (below average ratings) nearly doubled from 3 percent in 2018 to 6
percent (nearly 1 million people) in 2019.
For many years, the Centers for Medicare and
Medicaid Services (CMS) has posted quality ratings of Medicare Advantage plans
to provide beneficiaries with additional information about plans offered in
their area. All plans are rated on a 1 to 5-star scale, with 1 star
representing poor performance, 3 stars representing average performance, and 5
stars representing excellent performance. CMS assigns quality ratings at the
contract level, rather than for each individual plan, meaning that each plan
covered under the same contract receives the same quality rating (and most
contracts cover multiple plans).
11. One in five
Medicare Advantage enrollees are in employer or union-sponsored group plans in
2019
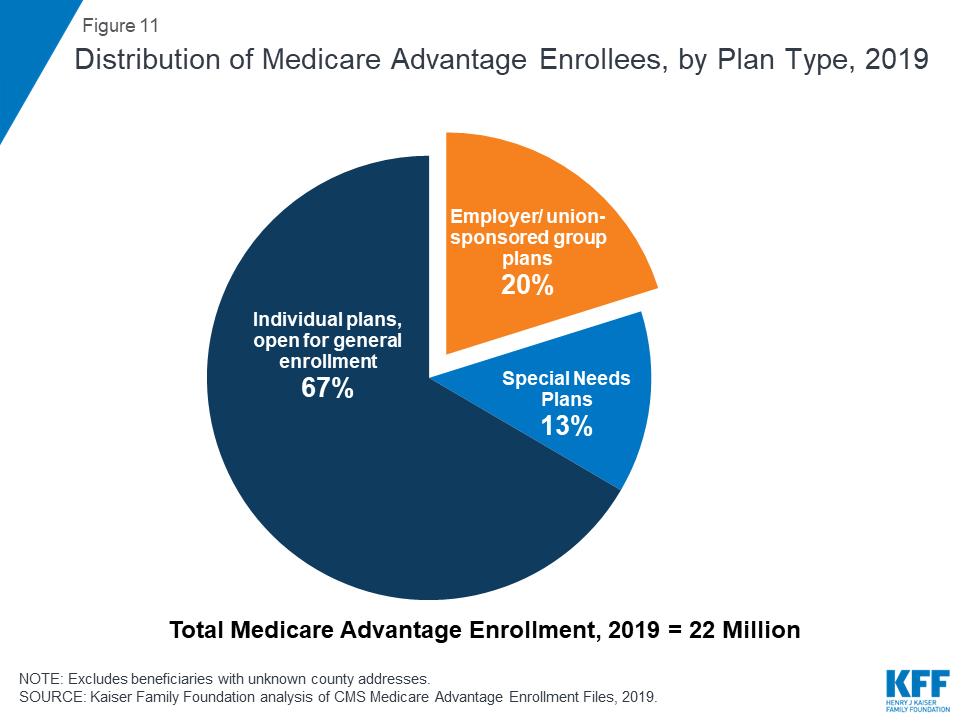
Figure 11:
Distribution of Medicare Advantage Enrollees, by Plan Type, 2019
One in five Medicare Advantage enrollees (4.4
million) are in group plans offered by employers and unions for their retirees
in 2019. Under these arrangements, employers or unions contract with an insurer
and Medicare pays the insurer a fixed amount per enrollee to provide benefits
covered by Medicare. The employer or union (and sometimes the retiree) may also
pay a premium for additional benefits or lower cost-sharing. Group enrollees
comprise a disproportionately large share of Medicare Advantage enrollees in
ten states: Alaska (100%), West Virginia (50%), Michigan (49%), New Jersey
(42%), Illinois (39%), Kentucky (38%), Wyoming (37%), Maryland (36%), Delaware
(35%), and New Hampshire (33%).
12. Nearly 3 million
Medicare beneficiaries are enrolled in Special Needs Medicare Advantage Plans
in 2019
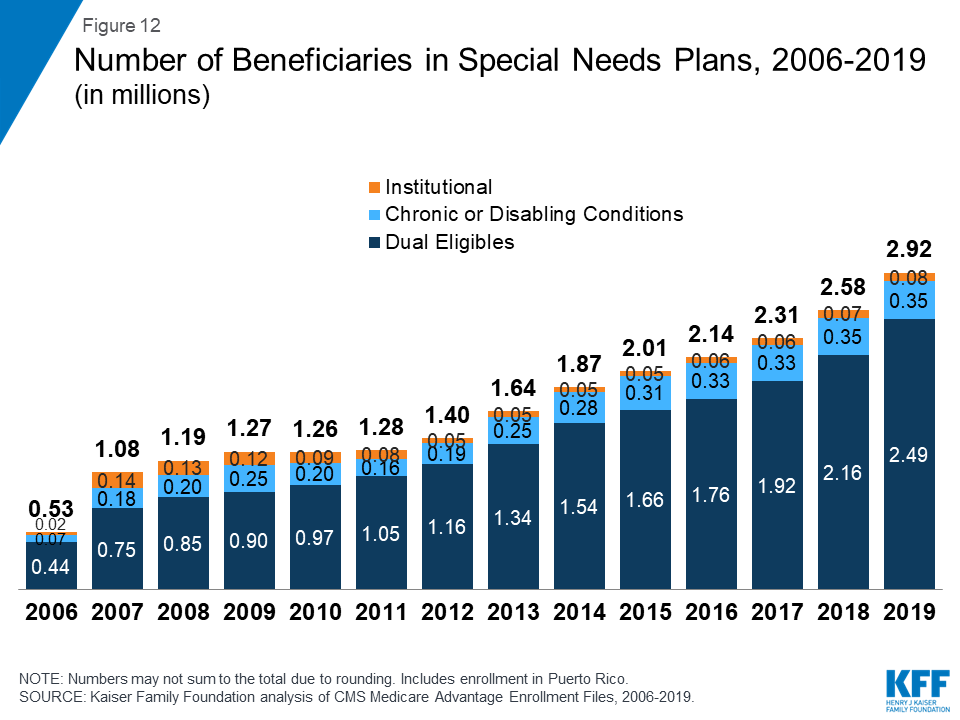
Figure 12: Number of
Beneficiaries in Special Needs Plans, 2006-2019 (in millions)
Special Needs Plans (SNPs) restrict enrollment
to specific types of beneficiaries with significant or relatively specialized
care needs. The majority of SNP enrollees (85%) are in plans for beneficiaries
dually eligible for Medicare and Medicaid (D-SNPs), with the remainder in plans
for beneficiaries requiring a nursing home or institutional level of care
(I-SNPs), or with severe chronic or disabling conditions (C-SNPs.)
Enrollment in SNPs increased modestly from 2.6
million beneficiaries in 2018 to 2.9 million beneficiaries in 2019, accounting
for about 13 percent of total Medicare Advantage enrollment in 2019, with some
variation across states. In seven states, the District of Columbia, and Puerto
Rico, enrollment in SNPs comprises at least one-fifth of Medicare Advantage
enrollment (51% in DC, 49% in PR, 25% in SC, 22% in NY, 21% in AR, 20% in AZ,
20% in FL, 20% in GA, and 20% in TN). Most C-SNPs enrollees (93%) are in plans
for people with diabetes or cardiovascular disorders in 2019. Enrollment in
I-SNPs has been increasing, but is still less than 100,000 beneficiaries.
Gretchen Jacobson, Meredith Freed, and Tricia
Neuman are with KFF.
Anthony Damico is an independent consultant.
Anthony Damico is an independent consultant.
|
Data and Methods
This analysis uses
data from the Centers for Medicare and Medicaid Services (CMS) Medicare
Advantage Enrollment, Benefit and Landscape files for the respective year,
with enrollment data from March of each year. Cost plans are grouped with
Medicare Advantage plans, and this chart collection uses the term Medicare
Advantage to refer to both types of plans, even though cost plans are paid
differently and subject to different rules.
|
No comments:
Post a Comment