March 8, 2022 Tara O'Neill Hayes
Executive Summary
·
New “generic” and “biosimilar” insulin products have come to
market and the competition they provide – prices at roughly one-half of the
brand name – has caused average insulin prices to decline slightly.
·
The impact on out-of-pocket spending in Medicaid and Medicare is
quite limited, however, with the result that relatively few patients switch to
the new products.
·
As a result, average spending per claim is relatively flat in
Medicaid and has continued to climb in Medicare Part D, up 6.8 percent from
2018 to 2020.
Introduction
Prior research from the American Action Forum
detailed the cost of insulin from the 1990s through 2018. New pricing data for
2019 and 2020 is now available from the Centers for Medicare and Medicaid
Services for Medicaid and Medicare Part D. While data through 2018 showed
insulin prices increasing each year, the new data show that average prices are
finally coming down. (The data are for list prices and do not account for
rebates, which are generally known to be quite large in the insulin market.)
This paper provides an updated analysis based on this new data.
In short, this analysis finds that the
introduction of new, half-priced “generic” insulin products has brought down
the average price of most types of insulin, but very few patients—at least
among Medicaid and Medicare beneficiaries— have switched to these lower cost
products. As a result, average insulin spending per claim has failed to
decline, leveling out in Medicaid but continuing to grow in Medicare. There are
several likely explanations as to why these low-cost products have not yet
gained any significant market share, but the most likely reason is that the
substantial rebates provided for brand-name products continue to allow them
preferential placement on the formulary.
Insulin Pricing Trends
Since 1991, growth in insulin prices has been
accelerating, with a reprieve only in recent years. The list price of insulin
per milliliter in the United States increased, on average, 2.9 percent annually
from 1991-2001, 9.5 percent annually from 2002-2012, 20.7 percent annually
between 2012-2016, and 1.5 percent annually from 2016-2018.[1]
New data
show that this slower growth turned into broad price reductions for the first
time in 2020 for all insulin types except newer ultra-long-acting insulins, as
shown in the chart below. The average price across all insulin products fell
6.2 percent from 2018-2020; however, average prices per unit are still double
what they were in 2012.

Explaining the Price Drop
The most
likely explanation for the drop in prices is the long-awaited introduction of
new insulin products and the power of competition. For years, many bemoaned the
fact that there was no generic insulin, largely because of regulatory hurdles
and technicalities, as explained here. Finally, in 2020, those barriers were lifted and at least one
manufacturer has finally produced a biosimilar insulin: Mylan’s Semglee is
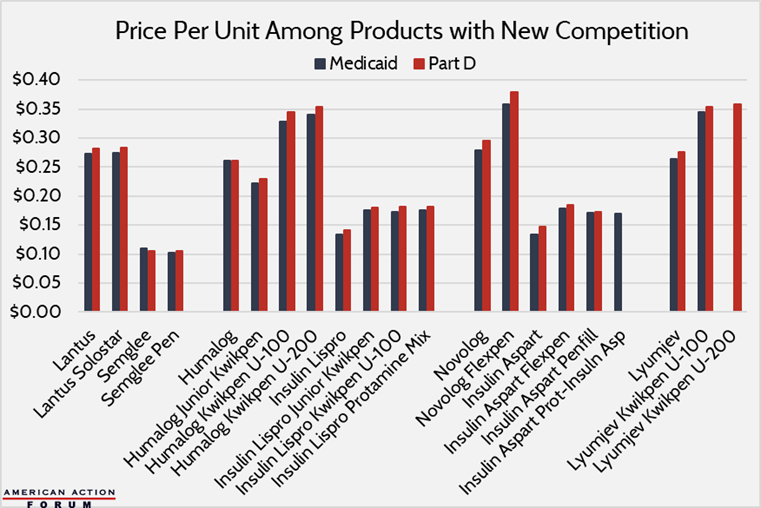
biosimilar to Lantus, the world’s top-selling insulin product.[2] Mylan sold this product for $11 per vial in Medicaid
and Medicare Part D, compared with a price for Lantus of $27 and $28,
respectively, in the two markets.
Additionally, as discussed here, several authorized generics were introduced
in 2019 and 2020. Eli Lilly introduced unbranded versions of its Humalog
insulin lispro products, most at roughly half the price of its brand-name
counterparts. Similarly, Novo Nordisk introduced unbranded versions of its
Novolog insulin Aspart products also at roughly half the price of its
brand-name products.
Eli Lilly also introduced a new brand-name product
in 2020: Lyumjev, which works even faster than its well-established,
rapid-acting Humalog product and is priced just slightly higher.
Assessing the Impact
One may reasonably assume that these new
half-priced products would lead to substantial reductions in overall insulin
spending. Unfortunately, that is not the case.
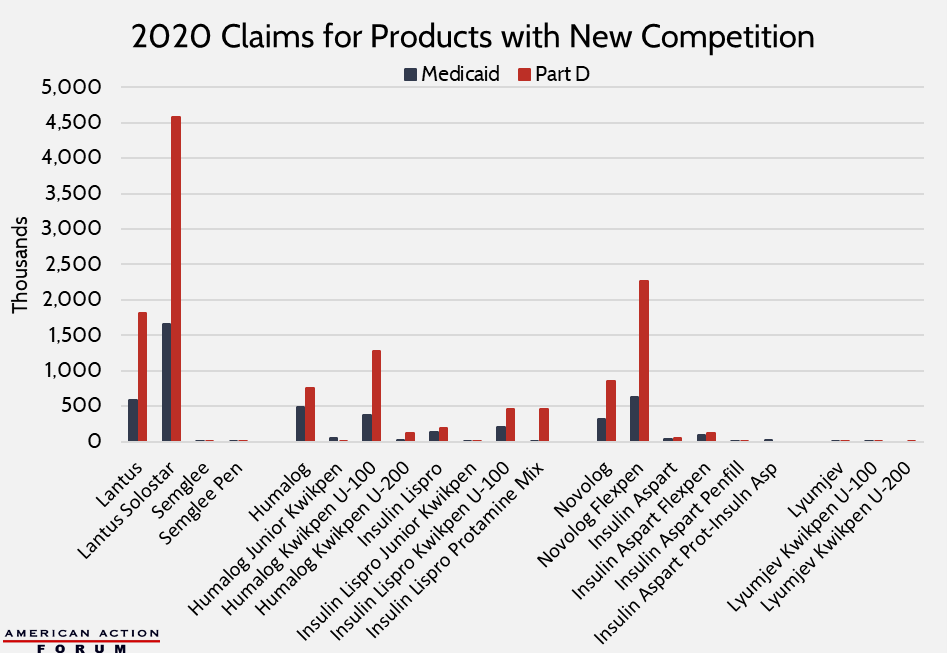
There is quite limited use of these new
products. For example, in 2020, there were more than 930,000 Medicaid claims
across all Humalog products but just 358,000 claims for the half-priced
authorized generic versions; usage rates of the two products were similar among
Part D patients. The same story is seen with Novolog: six times more patients used
the brand-name product than the generic version in Medicaid; in Medicare, there
were 17 times more claims for the brand-name products. Semglee, interchangeable
with Lantus, also had a hard time securing customers: There were 6.4 million
Part D claims for Lantus or Lantus Solostar in 2020, compared with less than
2,400 using Semglee or Semglee Pen.
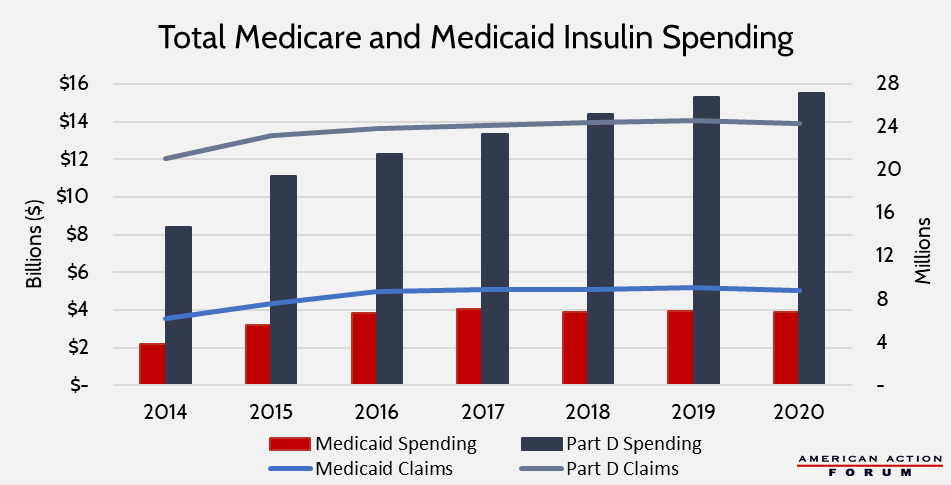
As a result of this limited take-up, program spending has not substantially
fallen, and in fact, has continued to increase in Medicare Part D, despite a
slight decline in claims growth.
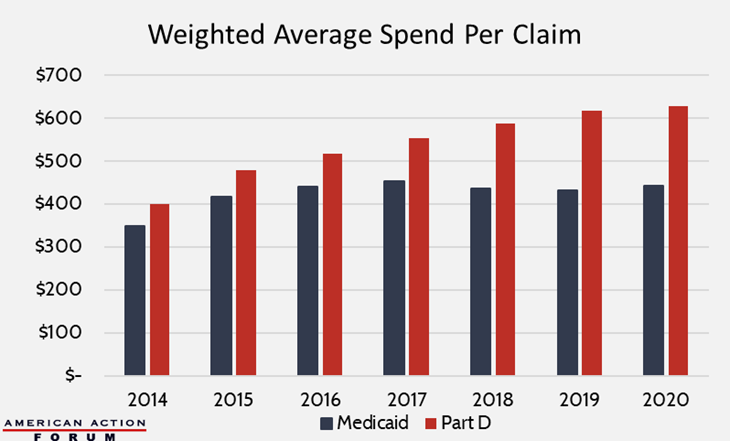
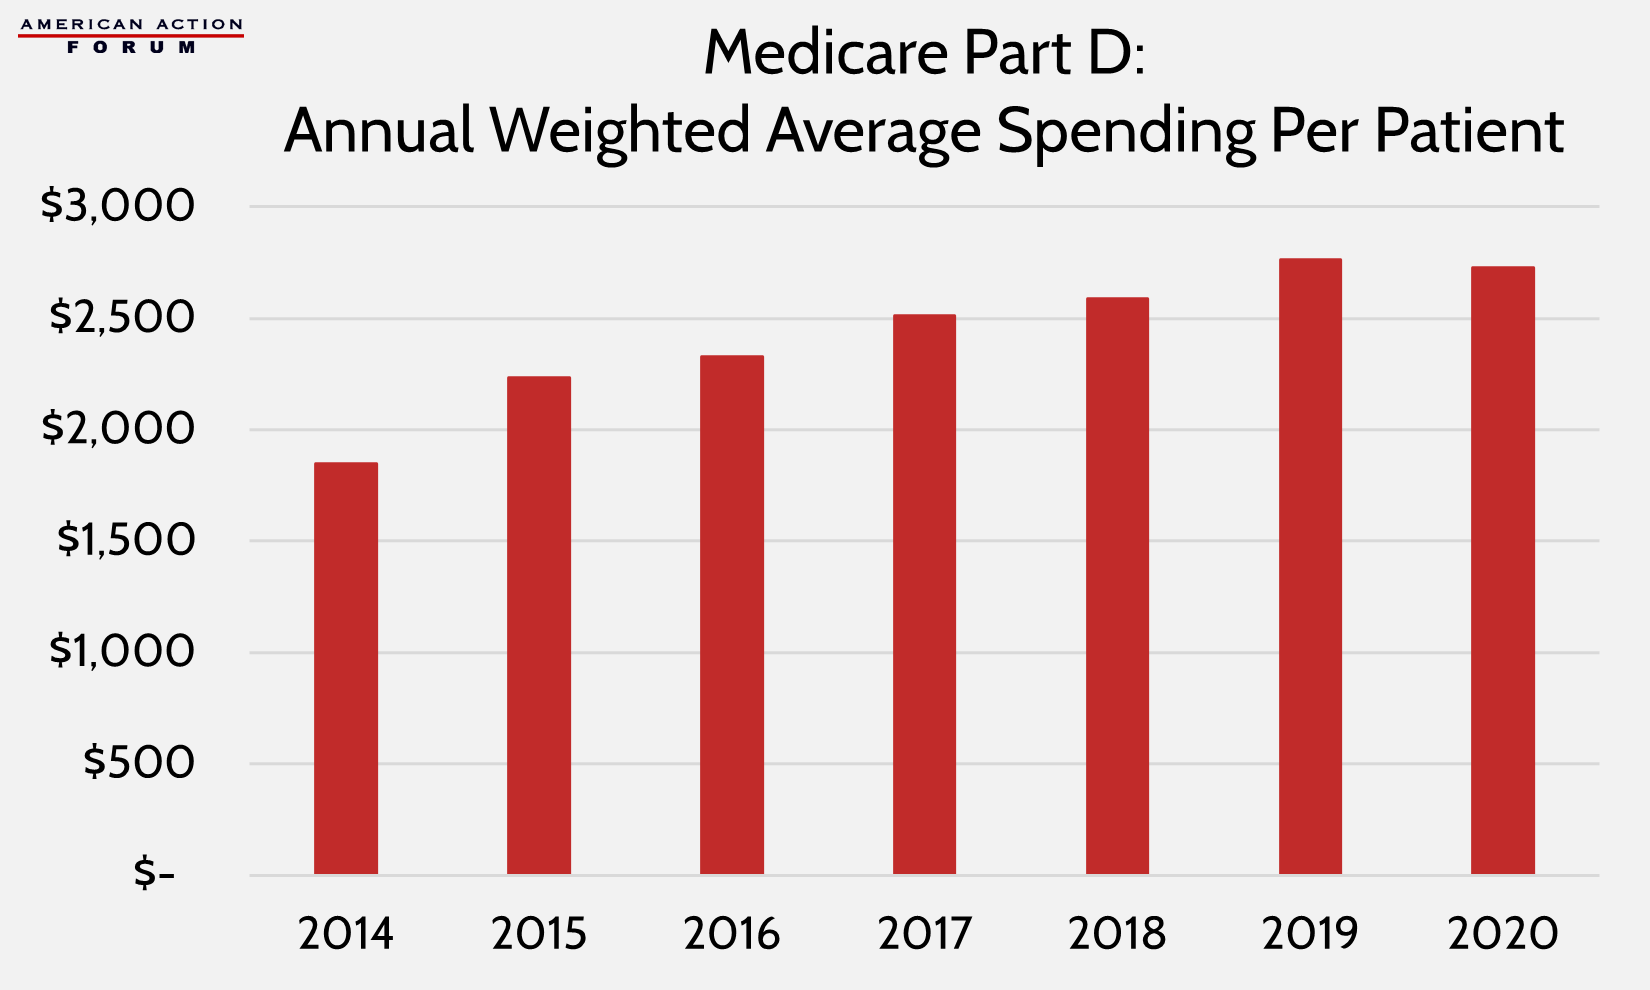
The following charts show individualized spending data, first on a per-claim
basis and then per patient (data on per-patient spending is unavailable for
Medicaid). The figures are weighted to account for volume among each specific
product. Again, the charts show that Medicaid insulin spending has leveled off,
while in Part D, spending per claim has continued to increase—up 6.8 percent
from 2018-2020, and spending per patient is down ever slow slightly from 2019
but still higher than spending in 2018.
There are a few explanations for the failure to achieve spending drops despite
price declines, many of which were previously predicted.
First, patients are often slow or even reluctant
to switch to new products. As explained here, many diabetics—particularly those with
type 1—often need multiple types of insulin, and when considering chemical
differences in insulins and biological differences among patients, there may be
very few regimen options that work well for a particular patient.
Second, the new insulin products are not being
widely sold at all pharmacies and thus have a physically limited customer base.
The data available for this analysis are exclusively for Medicaid and Medicare
Part D, and, as explained below, these beneficiaries do not have much financial
incentive to use the new insulin products. It is possible that these products
are being more widely used by the uninsured or those with private insurance,
but that data is not available for this analysis.
Further, it typically takes time for a new
product to gain market share and it may be a few more years before a more
meaningful presence in the market is picked up in the data.
Finally, and perhaps most important, Medicare
and Medicaid patients have very little financial incentive to use these new,
lower-cost products, highlighting the importance and size of pharmaceutical rebates. While the cash price
of these new products is much lower than the list price of the branded
products, the net price is likely on par with existing brand-name products. And
because insurers benefit from the steep rebates offered to get those lower net
prices, it is unlikely they will forfeit the rebates and place the new products
in preferential status on the drug formulary. Further, the out-of-pocket cost
that Part D patients would face is nearly equal to the cash price. Medicaid
patients are unlikely to switch products since they pay relatively little
out-of-pocket for any product.
[1] http://www.natap.org/2019/HIV/ioi150073.pdf, https://www.uofmhealth.org/news/archive/201604/sugar-shock-insulin-costs-tripled-10-years-study-finds, https://healthcostinstitute.org/diabetes-and-insulin/price-of-insulin-prescription-doubled-between-2012-and-2016, https://www.cms.gov/Research-Statistics-Data-and-Systems/Statistics-Trends-and-Reports/Information-on-Prescription-Drugs
[2] https://www.pharmaceutical-technology.com/features/featurethe-worlds-top-selling-diabetes-drugs-4852441/
https://www.americanactionforum.org/insight/insulin-prices-an-update/#ixzz7N5BkPl2O
Follow @AAF on Twitter

No comments:
Post a Comment