March
9, 2022 Tara O'Neill Hayes, Rakeb Asres
Executive Summary
·
Poor nutrition is a key
risk factor for numerous chronic diseases, most notably obesity, heart disease,
type 2 diabetes, and as many as 13 types of cancer.
·
These diseases reduce a
person’s likelihood of working, and those who do work are less likely to work
full-time and as productively as their peers without chronic disease.
·
The economic
implications of nutrition-related chronic disease are primarily reduced wages,
higher employment costs, and reduced government revenue.
·
This analysis estimates
the economic cost of the four nutrition-related chronic diseases among 18 to
64-year-olds at $16 trillion from 2011-2020 (or nearly 9 percent of gross
domestic product annually) after accounting for direct health care costs, lost productivity,
and lost wages.
Introduction
Poor
nutrition is more than a health care concern; it also has tremendous,
multifaceted economic implications. Poor diet leads to numerous chronic
diseases, often resulting in disability and premature death. This deprives
individuals of their health and quality of life, as well as their productive
potential, hindering their efforts to work full-time or at all, leading to
lower wages. For employers, absenteeism, functional limitations among their
employees, and the provision of health insurance pose tremendous costs.
Nationally, the quality and quantity of the labor force determines economic
output and government revenues. Simultaneously, demands for government
resources increase as people incur greater health care costs and become more
dependent on assistance when they are unable to work. Consequently, poor
nutrition is a large and rapidly growing burden for the United States.
This
analysis estimates the health and economic costs of the four most common
nutrition-related chronic diseases—heart disease, obesity, type 2 diabetes, and
as many as 13 types of cancer —among the working-age population. To do so, we
estimate the health care costs directly associated with these diseases, the
indirect costs due to lost productivity and lower wages, and lost government
revenue resulting from those lower wages and reduced employment. This analysis
estimates the total economic cost from 2011-2020 at $16 trillion, or nearly 9
percent of gross domestic product (GDP) annually.[i] Of
note, this estimate does not account for premature death or reduced lifetime
earnings, which other estimates suggest would significantly increase this cost.[ii] Further,
it does not account for comorbidities often associated with these diseases,
such as depression and chronic pain, which are also known to significantly
decrease productivity.[iii]
Scope of the Problem
Poor
nutrition is associated with the most common chronic diseases in the United
States: obesity, heart disease, stroke, type 2 diabetes, and as many as 13
types of cancer (which account for 40 percent of all cancers diagnosed in the
United States).[iv] Obesity
now affects 42 percent of American adults, or 109.5 million individuals.[v] Even
more Americans are estimated to have cardiovascular disease: 49.2 percent, or
126.9 million people in 2018; although, when excluding hypertension, this rate
falls to 9.3 percent, or 26.1 million in 2018.[vi] More
than 33 million Americans have type 2 diabetes.[vii] In
2018, there were an estimated 6.5 million people living with nutrition-related
cancer.[viii]
Given
that obesity is highly associated with each of these other diseases, there is
significant overlap in the people who are affected by these diseases and thus
simply adding up the prevalence for each would overestimate the number of
people afflicted by nutrition-related disease.[ix] That
said, it is estimated that at least 117 million American adults were living
with nutrition-related chronic diseases as of 2017, many of whom will die
prematurely as a result. In 2016, poor diet was the greatest risk factor for
death in the United States and the third leading cause of morbidity, accounting
for more than 500,000 deaths and 11 percent of all disability-adjusted life years lost (the
number of years either lost or not lived in full health due to disability).[x] With
the prevalence of obesity increasing at roughly 2 percent per year, this burden
is expected to worsen for the foreseeable future.
Calculating the Costs
In
estimating the health and economic costs associated with poor nutrition, this
analysis considers the prevalence of the four primary nutrition-related chronic
diseases among the working-age population (18 to 64 year-olds), the
health care costs associated with each disease, the effect of each disease on a
person’s likelihood of missing work or ability to be productive at work, the
likelihood of being unemployed because of chronic illness, and the
consequential impact on government revenues as a result of lower wages and the
growing need for assistance.
Details
regarding data sources and specific cost and prevalence considerations can be
found in the Methodology appendix. Most prevalence figures come from government
health agencies, while cost and productivity figures are sourced from available
literature on the subject. Projections for economic costs are largely based on
data from the Bureau for Labor Statistics.
Direct Health Care Costs
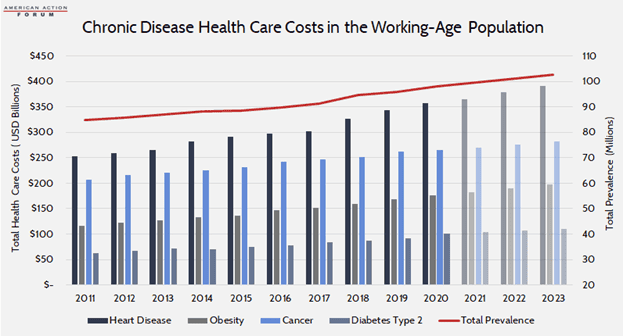
The
incremental health care costs associated with each disease range from an
estimated $2,500 for obesity (in 2017) to nearly $80,000, on average, for
treating any of the 13 identified types of cancer. From a societal perspective,
however, heart disease—at a cost of more than $20,000 per person—is the most
expensive overall due to its prevalence. Although, when considering obesity as
a risk factor for these (and other) diseases, it is estimated to be responsible
for 44 percent of all direct health care costs in the United States.[xi] In
total, between 2011-2020, these four diseases cost an estimated $7.6 trillion.
Over the following three years (2021-2023), these diseases will cost an
estimated $2.9 trillion.
These
costs are borne by individuals, their employers, and the government, with
variations largely dependent on whether or how individuals are insured. For
those with employer-sponsored insurance, employers typically pay 70-80 percent
of health care premiums, which are intended to cover the bulk of an average
individual’s annual health care costs.[xii] Of
course, individuals with any of these chronic conditions likely have
higher-than-average costs and will likely face significant out-of-pocket costs.
That said, many of these individuals are likely low-income, as having a low
income is a strong risk factor for chronic disease.[xiii] As
such, many who have nutrition-related chronic disease are likely covered by
Medicaid, in which case most costs are covered by the government (state and
federal). Two-thirds of Medicaid beneficiaries are overweight or obese, 28
percent have hypertension, and 26 percent report being in poor health.[xiv] The
remainder are likely uninsured, in which case the individual would bear the
brunt of the costs.
Indirect Costs: Lost Wages, Lower Productivity, and Reduced
Revenues
The
indirect costs associated with chronic disease similarly fall across the same
parties. While there are manifold indirect costs, some of which are difficult
to quantify, this analysis focuses on lower wages, productivity costs to
employers, and foregone government revenues.
Individuals
The
financial burden of chronic illness is felt most acutely at the individual
level. The primary indirect cost is lost wages—whether from an inability to
work at all or as much as one otherwise would if they were healthy. Household
income and savings are invariably diminished, continuing the downward spiral of
poor health and poverty. Studies estimate that chronic disease reduces one’s
wages anywhere from 6 percent to as much 18 percent.[xv] This
is felt distinctively by men and women in the workforce; women with chronic
disease face a larger percentage reduction in wages, and men face a greater
reduction in the number of hours worked.[xvi] This
effect compounds over time: chronic illness will cost the individual
progressively more as health care costs increase and the effect of missed
promotions and raises flattens one’s lifetime earning potential. Individuals
also lose out on the benefit of compounding interest when they are unable to
save which may severely limit one’s financial stability in retirement.[xvii] Further,
just as poor health can reduce employment and thus income, poor economic
conditions can cause poor health. Unemployment is associated with reduced
consumption of fruits and vegetables and increased consumption of snacks and
fast food which may exacerbate existing health problems.[xviii]
Chronic
disease also keeps many people out of the labor force altogether. One study
found that chronic disease reduces employment by 5 percentage points, which
translates to nearly 12 million fewer people working each year over the past
decade.[xix]
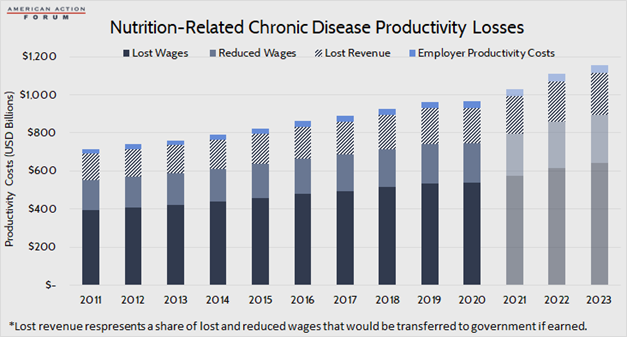
Between
the reduction in wages among those unable to work as much or to be as
productive as they otherwise would and the foregone wages from an inability to
work at all, it is estimated that that the overall reduction in wages due to
obesity, heart disease, type 2 diabetes, and nutrition-related cancer totaled
$8.1 trillion between 2011-2020. Reduced wages among the working accounts for
28 percent of lost income. It is estimated that another $3.2 trillion in wages
will be lost from 2021-2023.
Employers
Employers
face costs due to reduced output when workers miss time at work (absenteeism)
or are less productive at work because of limitations from their disease
(presenteeism); although, these costs—particularly related to presenteeism—are
often passed through to workers in the form of reduced wages, as discussed.[xx] In
2019, U.S. employers lost an estimated half a trillion dollars in productivity
costs, resulting from 978 million days lost due to illness and another 540
million lost workdays due to underperformance on the job; note, however, that
this estimate is for all chronic disease, not just those being considered here.[xxi] This
analysis of the cost to employers is based on a study from 2008 that estimated
the amount of time over the course of a year that individuals’ ability to work
was adversely impacted due to various chronic diseases. Many studies have been
done on this subject—some finding higher costs, some lower—but this analysis
used this particular study because it included per-person costs for each of the
four diseases considered here. Those costs are adjusted each year by changes in
the average cost of compensation, just as was used in the original estimate.
Among
obesity, heart disease, diabetes, and cancer, cancer tends to have the largest
impact on an employee’s productivity as treatment can be a long and
debilitating process. It was estimated that in 2008, employees with cancer cost
their employers an average of $1,601 in lost productivity over the course of
the year compared with $200-$300 for obesity, heart disease, or diabetes.[xxii] These
estimates are based on an average of 54.9 hours of reduced productivity per
year, per person with cancer, 11.2 hours per person with heart disease, 11.1
hours per person with diabetes, and 7 hours per person with obesity. Based on
average annual prevalence over the past decade, and assuming an 8-hour workday,
this totals 113.5 million days of lost productivity as a result of these four
diseases, annually. After considering average annual compensation costs, this
productivity loss cost employers $295.9 billion from 2011-2020. It is estimated
employers will lose another $114.4 billion from 2021-2023.
Government
In
addition to individuals and employers, federal and state budgets also suffer
from nutrition-related chronic disease as the resulting lower wages and
employment reduces government revenues. Using a simple average tax rate of 20
percent, this analysis estimates that between 2011-2020, government revenues
were reduced by $1.6 trillion as a result of these four chronic diseases.
Between 2021-2023, another $636 billion will likely be forgone. Note that these
lost revenues are a share of—not in addition to—individuals’ lost wages.
Simultaneously,
more people will require government assistance because of their lower incomes.
So, while less money is coming in, more money must be spent, squeezing the
budget from both ends.
Those
who are unable to work because of diet-related illness may qualify for several
federal assistance programs, either directly because of a disability or because
of the resulting loss of income, including Medicaid, Social Security Disability
Insurance (SSDI), and the Supplemental Nutrition Assistance Program (SNAP).
An
estimated 3 percent of SSDI recipients have endocrine, nutritional, or
metabolic diseases.[xxiii] Based
on an average monthly payment of nearly $1,400 as of December 2021 and 280,000
recipients, these individuals receive assistance of roughly $4.6 billion
annually.[xxiv]
There
is strong evidence that SNAP is associated with obesity, although it is unclear
to what degree SNAP contributes to obesity or whether people who are already
obese are more likely to become SNAP recipients.[xxv] People
who are disabled may be eligible for SNAP.[xxvi] Assuming
3 percent of disabled SNAP beneficiaries are disabled due to nutrition-related
disease (the same as with SSDI) and an average monthly benefit of $216 per
person, nutrition-related disability is responsible for an estimated cost of
$280.8 million per year, as of 2021.[xxvii]
There
are likely many others who are eligible for SNAP, Medicaid, and other
income-related assistance programs because of nutrition-related earnings
challenges as previously mentioned, though it is difficult to quantify how
many.
Total Costs
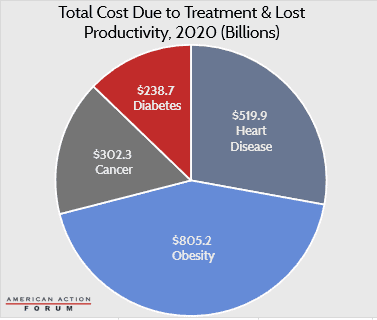
In
total, after considering increased health care costs, lost wages, lost
productivity, and lost revenue (which is a share of lost wages), this analysis
estimates that obesity, heart disease, type 2 diabetes, and the 13
nutrition-related cancers identified cost the U.S. economy $16 trillion between
2011-2020. From 2021-2023, as prevalence continues to grow and costs escalate,
it is estimated that the U.S. economy will lose another $6.1 trillion because of
these diseases.
There
are also other, sometimes less tangible costs incurred as a result of these
diseases that are not accounted for in this analysis. For example, the stress
and lost earnings incurred by family members who may have to spend time caring for a sick loved one. Poor
nutrition early in life can cause underdevelopment of the brain resulting in
mental and behavioral delays that could hinder one’s economic success later in
life.[xxviii]
Conclusion
Poor
nutrition has vast physical and economic consequences. Most Americans have a
poor diet, leading to a high prevalence of various chronic diseases. These
diseases may cause minor disruptions or hindrances to normal life for some while
being severely debilitating for others. Overall, nutrition-related chronic
diseases cause reductions in productivity, lost wages, and reduced economic
output. This translates to reduced revenue for the federal government while
simultaneously requiring more spending to treat the disease and provide
economic assistance for those unable to work to their full potential because of
illness. This analysis estimates that the overall economic cost of obesity,
heart disease, type 2 diabetes, and nutrition-related cancers totaled $16
trillion between 2011-2020.
Appendix: Methodology
This
analysis focuses on four common chronic diseases most closely associated with
poor nutrition: obesity, heart disease, type 2 diabetes, and 13 types of
cancer. Prevalence estimates are for those aged 18-64 to more closely reflect
the working-age population. Prevalence and per-person health care cost
estimates were sourced separately for each disease after a thorough review of
recent studies:
Heart
Disease
·
Prevalence: CDC, National Center for Health Statistics
·
Cost: “Medical Care Costs Among Patients With Established
Cardiovascular Disease” (used average cost for patients without
diabetes so as to assist with not double counting those costs and subtracted
the approximate cost of someone with no chronic conditions (roughly $2,000))
Obesity
·
Prevalence: Behavioral Risk
Factor Surveillance System
·
Cost: “Direct
medical costs of obesity in the United States and the most populous states”
Cancer
(13 Types)
·
Prevalence: NIH SEER Explorer (2018); Annual Incidence: CDC Wonder
·
Cost: NIH: Financial Burden of Cancer Care (average
for each of the 13 nutrition-related cancers; includes initial and continuing
care costs)
Diabetes,
Type 2
·
Prevalence: CDC Diabetes Atlas (Total diabetes
prevalence among 18 to 64 year-olds increased by 20 percent to account for undiagnosed,
then reduced by 10 percent to isolate type 2)
·
Cost: American Diabetes Association, “Economic Costs of
Diabetes in the U.S. in 2017” (costs attributed to diabetes for
individuals under 65)
After
obtaining health care cost estimates for a given disease in a given year, that
base year estimate was increased or decreased by the annual percentage change
in CPI-medical obtained from the Bureau of Labor Statistics (BLS) for each year
from 2011-2021. Projections for 2022-2023 were calculated using the average
annual growth rate of 2.4 percent projected by the Centers for Medicare and
Medicaid Services, Office of the Actuary for the period 2019-2028.
In
years for which data was not yet available, disease prevalence was estimated
using the average growth rate from the years in the past decade for which data
was available, except for heart disease, for which growth was projected at 1
percent consistent with projections from the American Heart Association and
with population growth.
Productivity
costs to employers are based on prior estimates from Journal for Population Health Management. The
per-person cost calculated for 2008 in that study was increased by the annual
percentage change in the average employer cost of compensation, published by BLS, the same
source used by JPHM. Total employer costs were calculated by multiplying the
per-person cost by the prevalence estimate for 18 to 64 year-olds reduced by 5
percent to approximate the number of individuals with the disease not working.
Revenue
loss estimates are equal to 20 percent of estimated lost wages. Lost wage
estimates were calculated for both those not working at all due to chronic
disease as well as estimates of reductions in wages for those working with a
chronic disease. To estimate the reduction in the number employed, the analysis
assumed a 5 percentage point increase in the labor
force participation rate and then used the unemployment rate for each year to
estimate the number of people who would otherwise be working if not for their
chronic disease. For those working with a chronic disease, it assumed wages
would otherwise be 7.5 percent higher (this is considered a conservative
estimate as estimates from the literature reviewed ranged from 6 percent to 18 percent). Average annual wages were
obtained from BLS. To forecast lost wages for 2021, 2022, and 2023, the
analysis used the Employment Cost Index from Wells Fargo‘s latest economic forecast to
estimate wage increases, and assumed the labor
force participation rate for 2022 and 2023 would be 63 percent
(the recent historical average leading up to the pandemic), that the
unemployment rate would be 3.5 percent, and accounted for expected increases in
the adult population. Overall disease prevalence was estimated at 41
percent among working-age adults (with obesity, heart disease,
diabetes, and cancer being among the most common chronic diseases).
[i] https://data.worldbank.org/indicator/NY.GDP.MKTP.CD?locations=US
[ii] https://www.who.int/management/programme/ncd/Chronic-disease-an-economic-perspective.pdf
[iii] https://pubmed.ncbi.nlm.nih.gov/19339899/
[iv] https://www.cdc.gov/chronicdisease/resources/publications/factsheets/nutrition.htm, https://www.cdc.gov/media/releases/2017/p1003-vs-cancer-obesity.html
[v] https://www.nber.org/digest/nov07/why-developed-world-obese, https://www.cdc.gov/obesity/data/adult.html, https://www.census.gov/library/stories/2021/08/united-states-adult-population-grew-faster-than-nations-total-population-from-2010-to-2020.html
[vi] https://www.ahajournals.org/doi/10.1161/CIR.0000000000000950
[vii] https://www.cdc.gov/diabetes/basics/type2.html
[viii] https://seer.cancer.gov/statfacts/html/all.html
[ix] https://www.ncbi.nlm.nih.gov/pmc/articles/PMC6003578/
[x] https://pubmed.ncbi.nlm.nih.gov/29634829/#&gid=article-figures&pid=figure-2-uid-1
[xi] https://milkeninstitute.org/sites/default/files/reports-pdf/ChronicDiseases-HighRes-FINAL.pdf
[xii] https://www.kff.org/report-section/ehbs-2021-summary-of-findings/
[xiii] https://www.americanactionforum.org/research/background-understanding-the-connections-between-chronic-disease-and-individual-level-risk-factors/
[xiv] https://www.macpac.gov/wp-content/uploads/2021/12/MACStats-Medicaid-and-CHIP-Data-Book-December-2021.pdf
[xv] https://ideas.repec.org/a/eee/quaeco/v44y2004i1p102-121.html, http://www.healthaffairs.org/do/10.1377/hblog20160418.054518/full/
[xvi] https://ideas.repec.org/a/eee/quaeco/v44y2004i1p102-121.html
[xvii] https://www.schwabmoneywise.com/essentials/benefits-of-compound-growth
[xviii] https://www.sciencedirect.com/science/article/abs/pii/S0277953611006460
[xix] https://onlinelibrary.wiley.com/doi/full/10.1038/oby.2006.188, https://www.bls.gov/charts/employment-situation/civilian-labor-force-participation-rate.htm, https://data.bls.gov/pdq/SurveyOutputServlet
[xx] To the extent that employer costs are
passed onto workers, there is the potential that those costs have been
double-counted in this estimate.
[xxi] https://www.ibiweb.org/resource/cost-of-poor-health-infographic-2019-data/#gf_1
[xxii] https://www.ncbi.nlm.nih.gov/pmc/articles/PMC3128441/figure/f1/
[xxiii] http://pressbooks-dev.oer.hawaii.edu/humannutrition/chapter/the-endocrine-system/
[xxiv] https://www.ssa.gov/policy/docs/statcomps/di_asr/2015/sect01c.html#table24,
https://www.ssa.gov/oact/STATS/dibGraphs.html#3
[xxv] https://www.ncbi.nlm.nih.gov/pmc/articles/PMC4580337/
[xxvi] https://www.fns.usda.gov/snap/eligibility/elderly-disabled-special-rules
[xxvii] https://www.fns.usda.gov/data/september-2021-keydata-report
[xxviii] https://www.cdc.gov/chronicdisease/resources/publications/factsheets/nutrition.htm
https://www.americanactionforum.org/research/the-economic-costs-of-poor-nutrition/#ixzz7NIFVOsVs
Follow @AAF on Twitter

No comments:
Post a Comment