 |
|
|
Monday, July 2, 2018
Centers for Medicare and Medicaid Services Releases Reports on the Performance of the Exchanges and Individual Health Insurance Market

CMS Takes Action to Modernize Medicare Home Health
|
|
|
|
Federal Legislation Related to Medicaid and Opioids: What to Watch
 |
Just Released
|
|
|
Federal Legislation Related to Medicaid and Opioids: What to Watch
With President Trump
having declared the opioid epidemic a public health emergency, both the House
and Senate are advancing legislation to address the crisis. A new issue brief from the Kaiser Family Foundation
summarizes current federal legislative proposals related to Medicaid’s role
in the opioid epidemic and identifies issues to watch as final legislation
takes shape.
The House has passed several bills culminating in
the Substance Use Disorder Prevention that Promotes Opioid Recovery and
Treatment (SUPPORT) for Patients and Communities Act. The Senate Finance
Committee has approved the Helping to End Addiction and Lessen (HEAL)
Substance Use Disorders Act, which is expected to be considered by the full
Senate later this year. Appendix tables detail the House SUPPORT Act, the
Senate HEAL Act, and other bills pending at the Senate and House committee
level as of late June, 2018
Any final legislation could affect state Medicaid
programs, SUD treatment providers, health plans, beneficiaries and other
stakeholders.
To see more of KFF’s work related to the opioid
epidemic visit our special resource page on this topic.
Filling
the need for trusted information on national health issues, the Kaiser Family Foundation is a nonprofit
organization based in San Francisco, California.
|
||
|
||
|
Connect with us:
    |
||
Social Security’s Purchasing Power Down 34% Since 2000
Pantagraph (Bloomington, IL) July 1,
2018
July 01--Each month, more than 62 million people receive a
Social Security check. Of these eligible beneficiaries, nearly 45 million are
aged beneficiaries, 62% of which rely on Social Security to provide at least
half of their monthly income. Suffice it to say that without the guaranteed
payout that Social Security offers, the elderly poverty rate in this country
would otherwise be significantly higher than it is now.
Yet, truth be told, the average retired worker benefit
isn't all that high. According to data from the Social Security Administration,
the average retired worker received $1,412.14 in May 2018, or $16,946 a year.
That's less than $5,000 above the federal poverty line for a single individual.
Even more interesting, or should I say worrisome, is the
fact that, according to a new analysis from The Senior Citizens League (TSCL),
a nonpartisan group that represents the interests of senior citizens, the
purchasing power of these Social Security dollars has been falling
precipitously since the turn of the century.
In the "2018 Social Security Loss of Buying Power
Study," where more than 1,000 seniors from across the country were
surveyed about their annual cost-of-living adjustment (COLA) and a bevy of
expenses they've paid, it was determined that Social Security benefits have
lost 34% of their purchasing power since the year 2000. In plainer terms, what
$100 in Social Security income would have bought in goods and services in 2000
now buys $66 worth of goods and services.
Should these findings really shock anyone? Probably not. A
May 2018 TSCL survey found that despite receiving a 2% "raise" (i.e.,
COLA) from Social Security in 2018, a combined 50% of respondents either saw
their benefit drop, stay the same as in 2017, or rise by $5 or less, thanks to
the hold harmless provision. Meanwhile, 56% of the "Loss of Buying Power
Study" respondents said their expenses rose by more than $79 in 2018.
As an aggregate, TSCL notes that the average Social Security
benefit has increased by 46% since 2000. However, the 39 costs it examined,
which are representative of expenses that seniors often deal with, rose by an
average of 96.3% over this same time period. Assuming an average benefit of
$816 per month back in 2000, the typical retiree today needs $410 more a month
from Social Security than they're currently receiving just to be on par with
where they were 18 years prior.
In particular, TSCL listed 10 expenses that have more than
doubled since 2000, including Medicare Part B premiums (up 195%), annual
average out-of-pocket prescription drug expenses (up 188%), homeowner's
insurance (up 164%), Medigap plans (up 158%), and property taxes (up 129%), to
name a few.
Social Security has an inflation problem that's incredibly
difficult to fix
Ultimately, aged beneficiaries are getting the short-end
of the stick because America's most important social program has an inflation
problem.
As it stands now, Social Security's COLA is tethered to
the Consumer Price Index for Urban Wage Earners and Clerical Workers (CPI-W).
As the name suggests, it measures the expenditures of urban and clerical wage
earners, many of which are considerably younger than retired workers. As a
result, medical expenses and housing costs aren't being properly reflected in
the inflation calculations each year, while other expenses, such as apparel,
education, and transportation, are being overemphasized.
Image source: Getty Images.
While there is a fix, it isn't without its own set of
consequences. The Consumer Price Index for the Elderly, or CPI-E, would
specifically take into account the expenditures of households with seniors aged
62 and over. If the CPI-E were used in place of the CPI-W, it would more
accurately reflect the costs that seniors face, therefore providing them with a
healthier annual COLA, and possibly reducing their persistent loss of
purchasing power. This is a solution regularly offered by Democrats on Capitol
Hill.
But here are the catches. First, the CPI-E fails to take
into account Medicare Part A expenses and Part B premiums, which aren't taken
into account by the traditional CPI-W, either. As a result, even with more
emphasis being placed on medical expenses, the CPI-E would still, likely,
underreport the actual medical expense inflation seniors are facing.
The other issue is that boosting Social Security's COLA
could more quickly put the program in dire straits. As a reminder, the Board of
Trustees' annual report, released in June, projects that the program will begin
paying out more in benefits than it generates in revenue this year. By 2034,
the $2.9 trillion in asset reserves that have been accumulated over decades
will be completely exhausted, potentially leading to an across-the-board cut in
benefits of up to 21%. By increasing COLA via the switch to the CPI-E, this
2034 exhaustion date could be moved forward.
Comparatively, Republicans have proposed swinging the
pendulum in the other direction by using the Chained CPI in place of the CPI-W.
The Chained CPI and CPI-W are similar in how they measure inflation, with one
notable difference: substitution bias. The Chained CPI takes into account the
desire of consumers to trade down to cheaper goods and services when one gets
too pricey. Because of this trade-down assumption, the Chained CPI tends to
grow more slowly than the CPI-W, and much slower than the CPI-E. In essence, it
would probably result in even larger purchasing power losses for seniors.
At the end of the day, Democrats and Republicans are so
fiercely divided over Social Security that nothing is getting done. If the GOP
were to be successful in pushing for the Chained CPI, seniors would lose
additional purchasing power. If Democrats went with the CPI-E, seniors might
find some temporary relief, but would likely still lose purchasing power and
bring Social Security's longer-term dilemma to head even faster. This inflation
problem isn't an easy fix, and it's liable to continue ravaging the pocketbooks
of seniors for some time to come.
The $16,728 Social Security bonus most retirees completely
overlook
If you're like most Americans, you're a few years (or
more) behind on your retirement savings. But a handful of little-known
"Social Security secrets" could help ensure a boost in your
retirement income. For example: one easy trick could pay you as much as $16,728
more... each year! Once you learn how to maximize your Social Security
benefits, we think you could retire confidently with the peace of mind we're
all after. Simply click here to discover how to learn more about these strategies.
___
(c)2018 The
Pantagraph (Bloomington, Ill.)
Visit The
Pantagraph (Bloomington, Ill.) at www.pantagraph.com
Distributed by
Tribune Content Agency, LLC.
Explaining Stewart v. Azar
|
|
Just Released
|
|
|
Explaining Stewart v. Azar, the Federal
District Court Decision Invalidating Kentucky’s Medicaid Waiver
A new issue brief from the Kaiser Family Foundation
explains the June 29 federal court ruling invalidating the Kentucky HEALTH
Medicaid waiver program and its implications for other states. The DC Federal
District Court decision in Stewart
v. Azar blocked Kentucky from implementing the waiver on July 1,
including its work requirement, monthly premiums up to 4% of income, coverage
lockouts for failure to timely renew eligibility or timely report a change in
circumstances, and other provisions.
The court held that the primary purpose of
Medicaid is to provide affordable health coverage. It determined that the
approval of the waiver by the federal secretary of Health and Human Services
violated the law because he did not consider the plan’s impact on furnishing
medical assistance – providing affordable health coverage -- to the
low-income populations identified by Congress in the Medicaid statute.
Specifically, the secretary never discussed how many people would lose
coverage, despite the state’s estimate that 95,000 people would lose
Medicaid, the court found.
The secretary also failed to cite any evidence
that some enrollees would gain private coverage as a result of the waiver or
estimate how many might do so. In addition, the court found that the
secretary cannot prioritize the impact on “traditional” or “vulnerable”
Medicaid populations at the expense of the Medicaid expansion group.
The court vacated the waiver and remanded it to
HHS to make a decision that is supported by the administrative record. The
ruling comes at a time when the Trump Administration is encouraging states to
impose work requirements in Medicaid. The decision sets the stage for appeals
and future litigation that could affect the other states with approved work
requirement waivers as well as how HHS and the states address these issues in
the future.
For more information on which states are seeking
waivers for work requirements and other provisions, visit our Medicaid waiver tracker.
Filling
the need for trusted information on national health issues,
the Kaiser Family Foundation is a nonprofit organization based in San
Francisco, California.
|
||
|
||
|
Connect with us:
|
||
SHORT-TERM INSURANCE SCORING ROUNDUP
Jonathan Keisling June 29, 2018
In February, the Trump Administration released
its proposed rule on short-term limited-duration insurance (STLDI) plans for
health care. The rule would change the legal duration of STLDI plans from three
months to 364 days, allowing them to function like traditional insurance. This
rule, partnered with the individual mandate penalty of $0 beginning in 2019,
will likely produce observable effects for the non-group insurance marketplace.
STLDI plans do not need to comply with the Affordable Care Act’s insurance
market reforms and therefore feature a narrower range of benefits partnered
with premiums that are significantly lower on average.
Multiple scorekeepers have weighed in on what
effects the proposed rule might have.
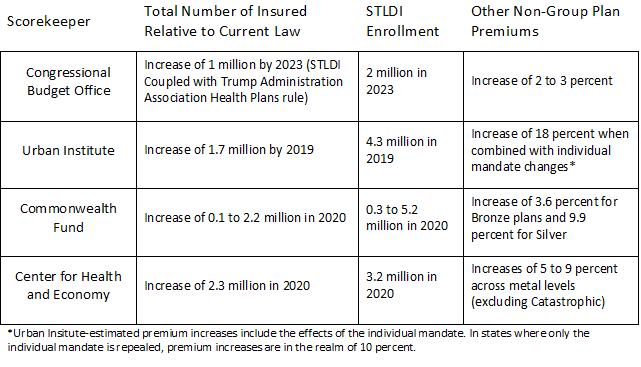
Each of the analyses in the table above had its
own set of assumptions and objectives. The Congressional Budget Office noted its
results within its most recent baseline update. The Urban Institute and the Commonwealth Fund sought to analyze the
STLDI rule, but they both also included in their analyses the combined effects
of the new individual mandate penalty and the STLDI rule. Meanwhile, the Center for Health and Economy already
included the new mandate penalty in their baseline and only considered the
effects of the STLDI rule.
Correctly predicting the future is hard in
general, and scoring STLDI plans presents its own peculiar challenges. The
scorekeepers point out that this rule will affect every level of the insurance
marketplace. Factors that could change include: insurers’ decisions to offer
qualified health plans, insurers’ rate setting, risk-pool make up, consumer
behavior, and STLDI plan designs themselves. Each score deals with these
uncertainties differently, either by providing a range of outcomes or by
outlining their assumptions.
What can be learned from the analyses? Despite
the differences in the aims of each score and the magnitudes of its
predictions, there seems to be a consensus that, by virtue of their low
premiums, STLDI plans will be attractive to consumers, and thus enrollment will
likely be in the millions. Each scorekeeper concludes that both those currently
insured and the uninsured will purchase STLDI plans, and that premiums will
rise in other non-group plans because some of those currently insured will
shift into STLDI plans. Yet even though premiums for the rest of the non-group
marketplace will rise, each scorekeeper expects non-group enrollment to
increase overall.
Whether or not these outcomes ultimately prove
good for consumers and the market, the administration’s new regulation on STLDI
plans will be consequential.
https://www.americanactionforum.org/weekly-checkup/short-term-insurance-scoring-roundup/#ixzz5K6oB04M2
Follow us: @AAF on Twitter
Valuing Your Equity Stake in the Federal Government
The old joke is that
the federal government has become a large financial institution with side
businesses in national defense and poverty programs — think of the myriad
financial products it offers: health insurance, flood insurance, mortgage
insurance, student loans, small business loans, crop insurance, and more.
Viewed from that perspective, the taxpayers are the equity investors in this
large financial institution. How should they think about the risks of this
investment? The Congressional Budget Office (CBO) put out a nice reminder
this past week entitled “Fair-Value
Estimates of the Cost of Federal Credit Programs in 2019” that contained
the following summary:
Using FCRA [Federal
Credit Reform Act] procedures, CBO estimates that new loans and loan
guarantees issued in 2019 would result in savings of $37.4 billion. But
using fair-value procedures, CBO estimates that those loans and guarantees
would have a lifetime cost of
$37.9 billion. More than 80 percent of the difference between those amounts
comes from three sources:
- The
guarantees that Fannie Mae and Freddie Mac will make in 2019,
analyzed on a FCRA basis, are projected to save the federal
government about $23.5 billion. under fair-value
accounting, however, the guarantees would cost about $2.5
billion.
- The
Department of Education’s student loan programs are projected to save $4.1
billion on a FCRA basis but to cost $16.1 billion on a fair-value
basis.
- The
Department of Housing and Urban Development’s (HUD’s) loan and loan
guarantee programs are projected to save $9.5 billion on a FCRA basis
but to cost $7.1 billion on a fair-value basis.
When the CBO (or the Office of Management and Budget, OMB) looks at a loan, insurance product, loan guarantee or other financial transaction it follows a simple procedure: (a) it looks over the entire lifetime of the transaction, (b) it calculates the year-by-year outflows from the Treasury, (c) it calculates the year-by-year inflows of payments to the Treasury, and (d) it calculates the net cash amount in the present that has the same lifetime value as owning (b) and (c). (This is known as the “present” value of the those cash flows.) CBO is saying that the FCRA approach indicates that owning the cash flows is the same as having $37.4 billion in your pocket — a good thing — and the fair-value approach indicates that it is the same as owing $37.9 billion — a bad thing.
The essential thing to notice is that the two approaches use exactly the same year-by-year cash flows in and out of the Treasury. There is no disagreement about the performance of the financial product. They differ only in how they treat the risk in the environment surrounding the transaction. The FCRA approach ignores those risks — recessions, recoveries, market booms, market busts, etc. It treats a dollar taken from the private sector in good times the same as a dollar taken in bad times, and a dollar paid out in good times the same as a dollar in bad times. But in bad times, cash is dear and payments made are more costly and cash received more valuable than when the economy is flush. The fair-value approach incorporates this market risk into its valuation of the programs.
Looked at from this perspective, the federal government is involved in activities — especially in housing and education — that might look good on average (FCRA), but when they go bad, they go really bad at the worst time (fair-value). The failure to anticipate and prepare for this risk is exactly why Fannie Mae and Freddie Mac are in conservatorship and the remaining loan programs are on dicey financial footing. It is important information for taxpayers because they may be uncomfortable with holding those risks, which would mean that it makes sense to reform the loan and guarantee programs.
Subscribe to:
Posts (Atom)