This
week, an agency-by-agency look at key regulatory agenda data.
The week
of Thanksgiving was a relatively limited one in the pages of the Federal
Register, so it’s worth taking a deeper dive into the Fall 2019 Unified
Agenda of Regulatory and Deregulatory Actions, featured in this
space last week.
While we
wait for final accounting from the Trump Administration to see how agencies did
relative to their FY 2019 regulatory budgets, the latest regulatory agenda
sheds some light on the pipeline of federal regulatory and deregulatory
activity.
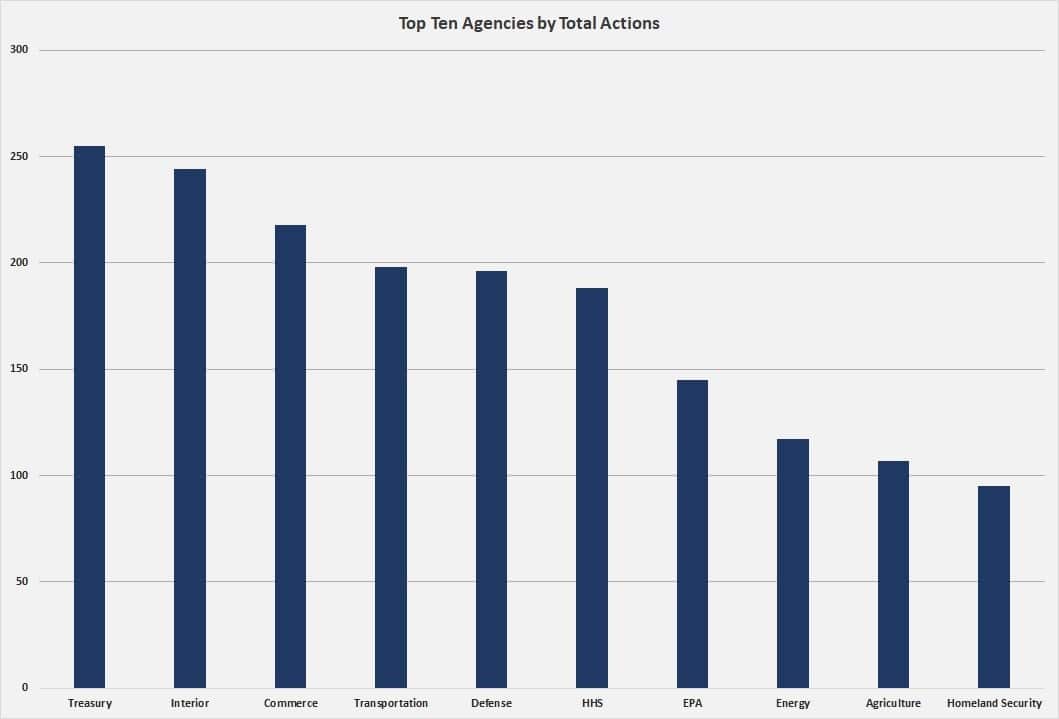
The chart above shows the 10 agencies with the largest number of rulemakings under development. These agencies combine to make up 68 percent of all rulemakings listed in the regulatory agenda.
When these agencies are broken down into their
expected regulatory and deregulatory actions for purposes of EO 13,771, we find
that the number of deregulatory actions is not necessarily proportional to the
number of total actions.
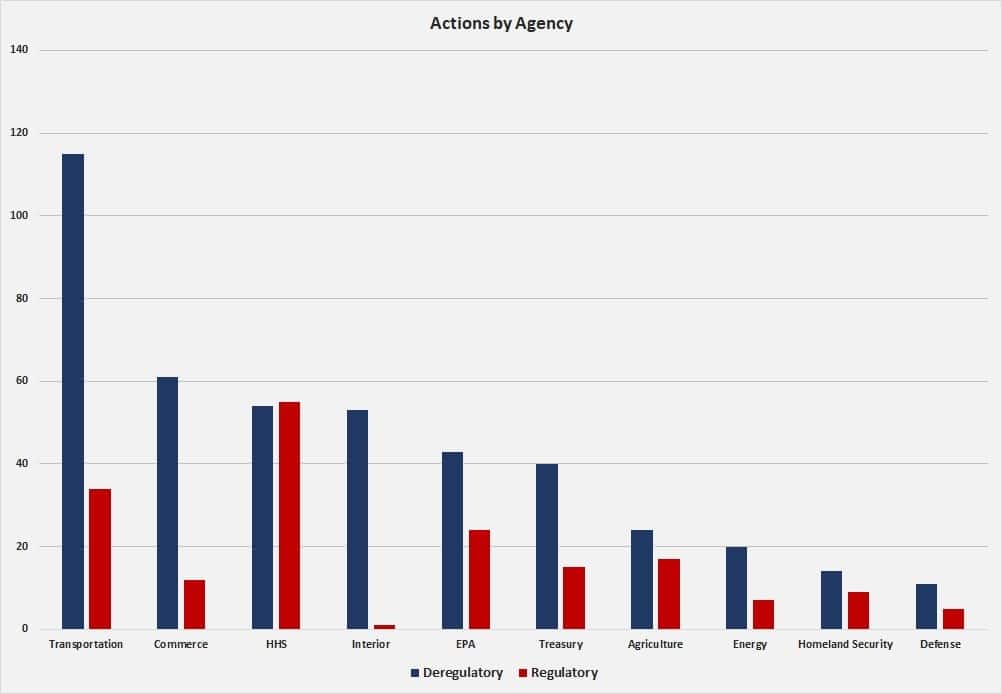
DOT has the most deregulatory actions despite having the fourth-most total actions. At 58 percent, its percentage of deregulatory actions is by far the largest of any agency listed here. The next closest are the Environmental Protection Agency (30 percent) and HHS (29 percent). The Department of the Treasury, which had the most total actions, has just a 16 percent deregulatory rate.
The main takeaway from the charts is while
having a lot of total actions in the regulatory agenda helps agencies have a
larger number of deregulatory actions, it is far from the determining factor.
TOTAL BURDENS
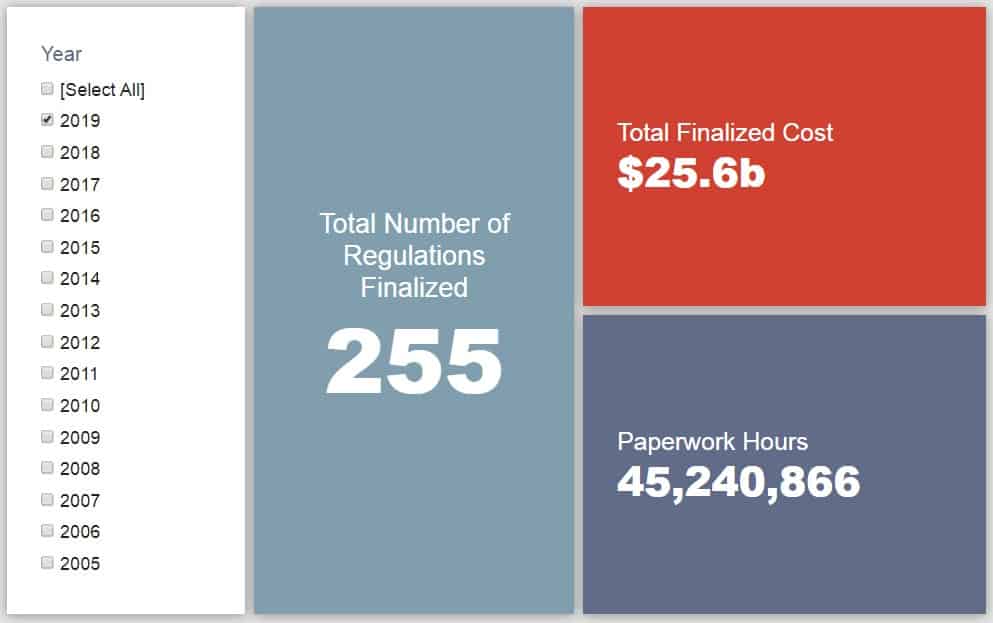
Since January 1, the federal government has
published $79.6 billion in total net costs (with $25.6 billion in finalized
costs) and 57 million hours of net annual paperwork burden increases (with 45.2
million coming from final rules). Click
here for the latest Reg Rodeo findings.
https://www.americanactionforum.org/week-in-regulation/a-pair-of-health-care-transparency-regulations-highlight-short-week/#ixzz673vusBxp
Follow: @AAF on Twitter
Follow: @AAF on Twitter
No comments:
Post a Comment