Juliette Cubanski Follow @jcubanski on
Twitter , Wyatt Koma, Anthony Damico, and Tricia Neuman Follow @tricia_neuman on
Twitter Published: Nov 04, 2019
·
Appendix
Many
policymakers and presidential candidates are discussing proposals to build on
Medicare in order to expand insurance coverage and reduce health care costs,
and improve financial protections and lower out-of-pocket costs for people
currently covered by Medicare. More than 60 million people ages 65 and older
and younger people with long-term disabilities currently rely on Medicare to
help cover their costs for health care services, including hospitalizations,
physician visits, prescription drugs, and post-acute care. However, Medicare
beneficiaries face out-of-pocket costs for their insurance premiums, cost
sharing for Medicare-covered services, and costs for services that are not
covered by Medicare, such as dental care and long-term services and supports.
In
2016, the average person with Medicare coverage spent $5,460 out of their own
pocket for health care (Figure 1). This average includes spending by community
residents and beneficiaries residing in long-term care facilities (5% of all
beneficiaries in traditional Medicare). Among community residents alone,
average out-of-pocket spending on premiums and health care services was $4,519
in 2016. But some groups of beneficiaries spent substantially more than others.
Current Medicare-for-all
proposals in Congress and from presidential candidates would largely
eliminate out-of-pocket costs for premiums and patient cost sharing, including
for people now covered under Medicare.
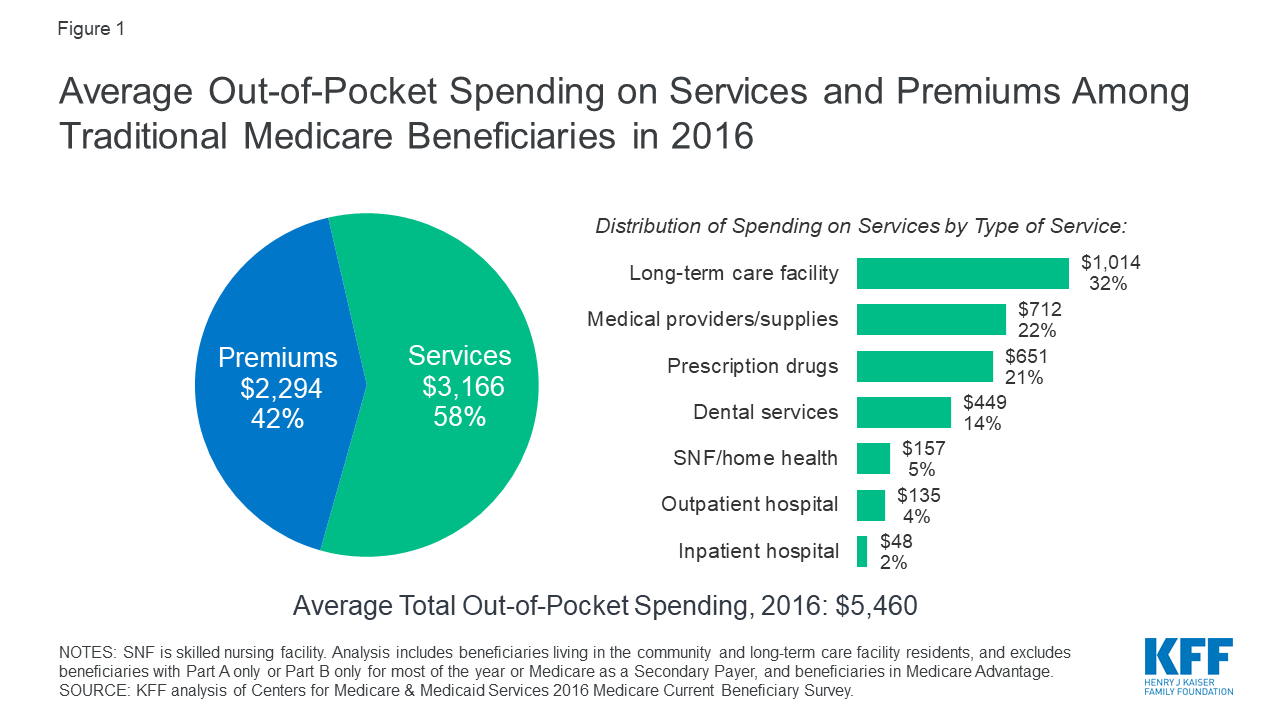
Figure 1: Average Out-of-Pocket Spending on Services and
Premiums Among Traditional Medicare Beneficiaries in 2016
This
analysis presents the most current data on out-of-pocket health care spending
by Medicare beneficiaries, both overall and among different groups of
beneficiaries. The analysis addresses three main questions:
The
analysis is based on the most current year of out-of-pocket spending data
available (2016) from the Medicare Current Beneficiary Survey (MCBS), a
nationally representative survey of Medicare beneficiaries. The analysis
includes beneficiaries living in the community and long-term care facility
residents, and excludes beneficiaries enrolled in Medicare Advantage due to
unverified reporting of events and spending for these beneficiaries in the MCBS.
(See Methodology for details). All
results presented in the text are statistically significant (see Appendix to access a
downloadable table of results).
How much do Medicare beneficiaries spend out of pocket in total
on premiums and services?
The
graphic below shows how much the average person with traditional Medicare spent
out of pocket for health care in 2016. Total out-of-pocket spending includes
spending on medical and long-term care facility services and insurance
premiums, with comparisons across different groups of beneficiaries.
Average Out-of-Pocket Health Care Spending by Traditional
Medicare Beneficiaries in 2016
Our
analysis shows that Medicare beneficiaries spent $5,460 out of their own
pockets for health care in 2016, on average, with more than half (58%) spent on
medical and long-term care services ($3,166), and the remainder (42%) spent on
premiums for Medicare and other types of supplemental insurance ($2,294). This
average includes spending by community residents and beneficiaries residing in
long-term care facilities (5% of all beneficiaries in traditional Medicare).
Among community residents alone, average out-of-pocket spending on premiums and
health care services was $4,519 in 2016.
Average
total out-of-pocket spending varies considerably across different groups of
beneficiaries.
·
The oldest beneficiaries in traditional
Medicare, people ages 85 and older, spent more than twice as much out of pocket
as beneficiaries between the ages of 65 and 74 ($10,307 versus $5,021). This difference was
primarily due to significantly higher spending on long-term care facility
services among beneficiaries in the oldest age group.
·
Out-of-pocket spending by women in traditional
Medicare was higher than out-of-pocket spending by men ($5,748 versus $5,104).
·
Beneficiaries in poorer self-reported health,
those with multiple chronic conditions, and those with any inpatient hospital
utilization faced higher out-of-pocket costs than the average traditional
Medicare beneficiary. For instance, beneficiaries with at least one
inpatient stay in 2016 spent $7,613 out of pocket, on average, compared to
$5,044 among those without an inpatient stay.
·
Beneficiaries with no supplemental insurance
spent more out of pocket than beneficiaries with some type of supplemental
coverage. In 2016, nearly
one in five (6.1 million) Medicare beneficiaries did not have any
source of supplemental coverage, which placed them at greater risk of incurring
high medical expenses. People without any source of supplemental coverage were
also more likely to have modest incomes and be ages 85 or older. Out-of-pocket
spending averaged $7,473 among beneficiaries with no supplemental coverage in
2016, compared to $5,202 among beneficiaries with employer-sponsored coverage,
who also tend to have higher incomes, higher education levels, and are
disproportionately white. Beneficiaries with Medicaid, however, incurred the
lowest average out-of-pocket costs in 2016 ($2,665) compared to those with
other coverage types or none whatsoever. Higher out-of-pocket spending among
those with no supplemental coverage is due to higher spending on health-related
services, because supplemental coverage helps Medicare beneficiaries pay their
out-of-pocket costs for Medicare-covered services. For example, beneficiaries
with employer-sponsored coverage spent $2,476 on health-related services in
2016, on average, while those with no supplemental coverage spent $5,776.
How much do Medicare beneficiaries spend out of pocket on
different types of health-related services?
The
graphic below shows average out-of-pocket spending for specific health and
long-term care services by traditional Medicare beneficiaries in 2016, with
comparisons across different groups of beneficiaries.
Average Out-of-Pocket Health Care Spending by Traditional
Medicare Beneficiaries in 2016, by Type of Service
Of the
total average per capita spending on health and long-term care services in 2016
($3,166), Medicare beneficiaries spent the most on long-term care (LTC)
facility services, which are not covered by Medicare ($1,014, or 32% of average
out-of-pocket spending on services), followed by medical providers and supplies
($712; 22%), prescription drugs ($651; 21%), and dental services ($449; 14%).
These estimates are averaged across all traditional Medicare beneficiaries
including users and non-users of each service; average spending among users
would be higher than the averages presented here.
Average
out-of-pocket spending by service varies across different groups of
beneficiaries. For example:
·
Not surprisingly, beneficiaries living in long-term
care facilities (5% of traditional Medicare beneficiaries overall) spent
significantly more on LTC services than the average beneficiary in traditional
Medicare in 2016 ($19,632 versus $1,014). Out-of-pocket spending
was much higher among LTC facility residents who did not have Medicaid
($41,782), which is the primary source of public support for long-term care.
Out-of-pocket spending on long-term care facility services was also higher
among beneficiaries with certain types of chronic conditions, in particular,
Alzheimer’s disease or other dementia ($9,565 on average; $27,308 among LTC
residents only) and Parkinson’s disease ($4,120 on average; $28,165 among LTC
residents only)—as these beneficiaries are more likely to reside in a long-term
care facility than those with other conditions. Notably, these estimates of
out-of-pocket spending on long-term care facility services are lower than the
median estimated annual cost of a private room in a long-term care facility,
which was $92,000 in 2016. One
reason for the discrepancy is that the average out-of-pocket spending estimates
from the MCBS include beneficiaries who resided in a LTC facility for less than
a full year.
·
Average spending on prescription drugs was
higher for beneficiaries with multiple chronic conditions and those in
relatively poor self-reported health status. In 2016, traditional
Medicare beneficiaries with five or more chronic conditions spent $1,065 on
prescription drugs, on average, compared to $416 among those with one or two
chronic conditions; those in poor self-reported health spent $1,018 on drugs
compared to $410 among those in excellent self-reported health. In a separate
analysis of the out-of-pocket
cost burden for specialty drugs, we found that out-of-pocket drug costs
for Part D enrollees taking medications for selected conditions, including
cancer, hepatitis C, multiple sclerosis, and rheumatoid arthritis, can exceed
thousands of dollars annually on a single medication.
·
In 2016, traditional Medicare beneficiaries spent
an average of $449 out of pocket on dental services, which are typically not
covered by Medicare. Out-of-pocket spending on dental care increased with income,
likely because higher-income beneficiaries are better able to afford dental
services, while those with lower incomes are more
likely to go without needed dental care due to costs.
What share of income do Medicare beneficiaries spend on
out-of-pocket health care costs?
The
graphic below shows out-of-pocket spending on health-related services as a
share of total per capita income, at the median, with comparisons across
different subgroups of beneficiaries.
Median Out-of-Pocket Spending as a Share of Income for
Traditional Medicare Beneficiaries in 2016
Our
analysis shows that half of all beneficiaries in traditional Medicare spent at
least 12% of their income on out-of-pocket health care costs in 2016. One quarter
of all beneficiaries spent at least 23% of their incomes on health-related
services in 2016, while 10% spent nearly half of their income (data not shown).
The
median out-of-pocket health care spending burden varies by beneficiary
subgroups. For example:
·
The financial burden of health care as a share
of income falls disproportionately on lower-income Medicare beneficiaries. Half of traditional
Medicare beneficiaries with incomes below $10,000 spent at least 18% of their
total per capita income on health care costs in 2016, compared to 7% for those
with incomes of $40,000 or more. Having Medicaid coverage, however,
significantly reduces the out-of-pocket spending burden among low-income
beneficiaries. Beneficiaries with Medicaid spent just 5% of their total income
on out-of-pocket health care costs in 2016.
·
Medicare beneficiaries in older age groups
face a higher out-of-pocket spending burden than younger beneficiaries. Half of traditional
Medicare beneficiaries ages 85 and older spent at least 16% of their total
income on out-of-pocket health care costs in 2016, compared to 12% among those
ages 65 to 74.
·
People with multiple chronic conditions or in
poorer health spend more on health care out-of-pocket than those in better
health. For example, beneficiaries with five or more chronic conditions
spent 14% of their income on out-of-pocket health care costs in 2016, compared
to 8% among those with zero conditions. Those with any inpatient hospital stay
in 2016 spent 17% of their income on out-of-pocket health care costs, compared
to 11% among those without a hospital stay that year.
Discussion
In
2016, people with traditional Medicare spent an average of $5,460 out of pocket
for health care expenses, including premiums, cost sharing, and costs for
services not covered by Medicare. Half of all traditional Medicare beneficiaries
spent at least 12% of their total per capita income on health care. Although
Medicare has helped make health care more affordable for people with Medicare,
many beneficiaries face high out-of-pocket costs for care they receive,
including costs for services that are not covered by Medicare—in particular,
long-term care services. Some groups of beneficiaries face substantially higher
out-of-pocket costs than others, including women, those ages 85 and over, those
who are in poorer self-reported health and who have multiple chronic
conditions, and those with no supplemental coverage.
The
fact that traditional Medicare does not have an annual out-of-pocket limit and
does not cover certain services that older adults are more likely to need may
undermine the financial security that Medicare provides, especially for people
with significant needs and limited incomes. Addressing these gaps would help to
alleviate the financial burden of health care for people with Medicare,
although doing so would also increase federal spending and taxes.
Juliette
Cubanski, Wyatt Koma, and Tricia Neuman are with KFF.
Anthony Damico is an independent consultant.
Anthony Damico is an independent consultant.
https://www.kff.org/medicare/issue-brief/how-much-do-medicare-beneficiaries-spend-out-of-pocket-on-health-care/?utm_campaign=KFF-2019-The-Latest&utm_source=hs_email&utm_medium=email&utm_content=79063398&_hsenc=p2ANqtz-9JBAxBPjZoKDnUcvEFM8G0I2d8OgAaWNwUG1KfbWRShLzeRgFoLUUe2nevEUQrckIDuJml65Vxj0yBjZWWrGDjgKXH0A&_hsmi=79063398
No comments:
Post a Comment